


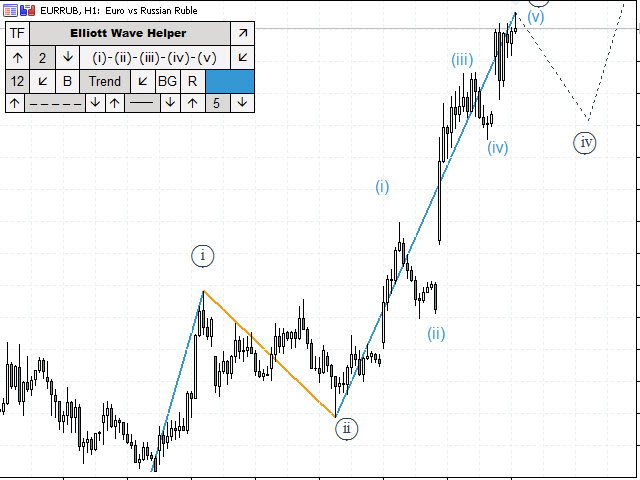

Elliott Wave Helper is a panel for marking up a chart based on Elliott waves and building technical analysis.
Allows you to build a wave analysis in a few clicks with the definition of the type and order of waves.
– A choice of color, style and font of the construction is available.
– Marking of pulses, triangles, zigzags, planes, simple and complex combinations is available.
A special wave font is supported. To activate it, you need to perform the following actions:
- Download the font from the link:
- Run the font file on your computer and click install.
- In the indicator parameters, set the value Use circle font next to the isFontCircle variable.
- The font size and fat content can also be adjusted from the panel.
– Allows you to build diagonal and horizontal support and resistance levels.
[spoiler title=”Read More…”]
– Allows you to build triangular and rectangular shapes.
To build a technical analysis on the indicator panel, select:
- Trend – the trend line
- Horizont – horizontal level
- Triangle – triangle
- Square – square
After holding the Shift key on the keyboard, left-click several times on the graph (depending on the type of line or shape) to draw the object.
- The BG button is responsible for drawing the background for a triangle or square.
- The R button is responsible for drawing the ray for the trend line.
There is also a selection of styles available for trend and horizontal lines, which can be changed on the panel and which includes the display type and the thickness of the lines.
After holding the Shift key on the keyboard, left-click several times on the graph (depending on the type of line or shape) to draw the object.
- The BG button is responsible for drawing the background for a triangle or square.
- The R button is responsible for drawing the ray for the trend line.
- The BG button is responsible for drawing the background for a triangle or square.
- The R button is responsible for drawing the ray for the trend line.
There is also a selection of styles available for trend and horizontal lines, which can be changed on the panel and which includes the display type and the thickness of the lines.
The panel allows you to display objects on the ranges that the analyst needs. You can select them in the upper-left corner of the panel.
If several timeframes are selected, the objects will be located only on them.
If no timeframe is selected, the objects will be located only on the current range.
- isFontCircle – Enable or not a special wave font
- anchorCharacter-Selecting a character binding
- objectasBG – To make trend lines and support and resistance levels as a background or not
- Selectbutton-Select the button that activates the rendering of technical analysis
- startCoordinateX – The position of the panel on the X axis
- startCoordinateY – The position of the panel on the Y axis
- colorTracing – The color of the stroke lines
- colorTextBtn – The font color of the buttons
- colorFonTop – The background color of the upper part of the panel (with the name)
- colorNameHeader – The font color of the panel name
- colorTracingPopup – The color of the outline of the drop-down menus
- colorTextBtnPopup – The color of the text of the drop-down menus
- colorFonButtonPopup – The background color of the drop-down menus
- colorFonLine – The background color of the informative panel elements
- colorFonButton – The background color of the active panel elements
- colorTr – The background color of the triangle
- colorSq – The background color of the rectangle
[/spoiler]