


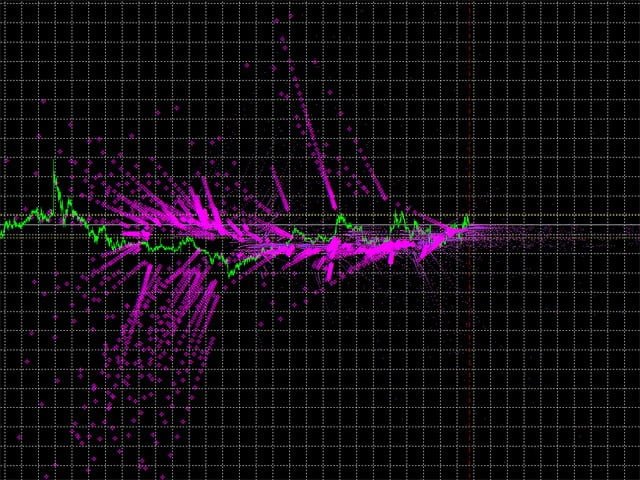

Visualization of the intersection of the characteristic lines of the DCMV indicator allows you to get a picture of the market environment of the price. The radiation is able to predict and confirm forecasts, draw support and resistance areas, and display the intensity of price movement. Many patterns of price changes are revealed to the trader using this technology.
PROPERTIES OF RADIATION or what you need to pay attention to:
- angle of inclination
- density
- bend
- distance from the zero bar
RECOMMENDATIONS
- Regularly clean the image, because a huge number of points load the image and it becomes difficult to read (example of a cleaning script);
- Configure the terminal: “chart on top”, “chart offset” = center, “color scheme” = Yellow on Black”;
- Configure the tester so that the rendering speed is approximately ~ 80%, otherwise half of the points will not be displayed;
- Use on the M1 timeframe;
- Use on instruments with high liquidity;
- Observe the radiation and many patterns will open up by themselves.