


2- Counter Trend Trader
How to Use Entry Assistant Dashboard?
Follow Trend Trader
1- See timeframe D2 BUY/SELL at section Supply Demand for Follow Trend
2- See BUY/SELL signal Entry or Engulfing any timeframe for entry
After you see both section Buy/SELL at Supply Demand and Entry section, you can enter position
Counter Trend Trader
1- See Rsi or Stch Level (Green for BUY) (Red for Sell)
2- See section Entry or Engulfing signal BUY/SELL for entry
After you see both BUY/SELL at Rsi/Stch and Entry section, you can enter position
* Please wait data price loading before use Entry Assistant Dashboard!
* To get the best entry must be an entry immediately after the signal comes out!
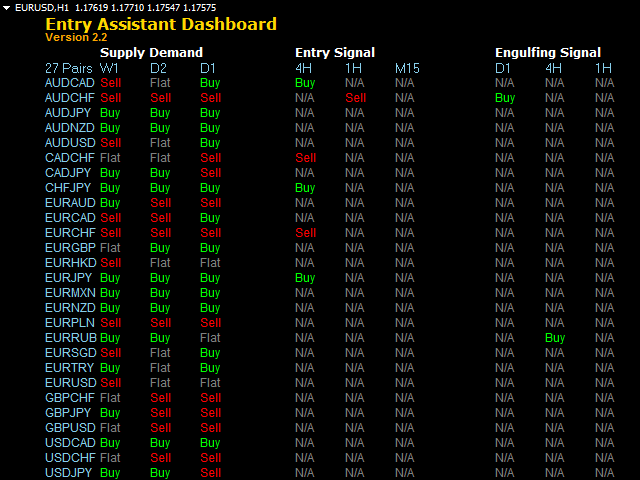
The contents of the Entry Assistant Dashboard System are:
Supply Demand
Function used to identify the desired currency market direction more precisely because it uses the demand and supply formulas. The method used in this section uses a complex calculation formula based on Supply Demand. It does not use the formula to look at the common trends we see such as Moving Average, Bollinger Bands etc. to identify the direction of the market. It is also not regular a currency strength meter that measures or calculates the strength or weakness of a currency which has a weakness to identify the beginning of a trend direction and the end of a trend.
Signal Entry
This is a very important core of this system because every entry displayed is very precise and valuable. The formula used does not use the overbought / oversold formula that we usually see on social media or even in public. It uses a complex True Range secret formula to identify the most beautiful entry points. This signal entry can be combined with any technique so that confirmation can be done before making a BUY or SELL decision.
Engulfing Signal
This is an additional signal based on the candlestick. On this system it only uses Engulfing Candlestick which is so popular nowadays. The use of this section is not so much emphasized on the use of this dashboard. It is just an addition to meet this system that some traders may need.
Direction
This is a market direction using the usual indicator formula, but it is also quite effective to help us make our entry decisions. It uses 1 hour TF because to filter the trends we see in large TF to smaller TF. It is used to reduce the error of our analysis results. Most professional traders use this method to see the boundary between Uptrend and Downtrend.
ReEntry
This is an additional function placed in this system to see the bounce potential on the candlestick. It is based on the BBMA technique which is very popular nowadays.
Stochastic
One of the facilities featured in this dashboard is live stochastic value information. It is used for those who counter the trend or see at the beginning of the trend.
Relative Strength Index
In addition, one facility displayed in this dashboard is live Relative Strength Index (Rsi) value information. It is used for those who counter the trend or see at the beginning of the trend.
Spread
A spread display has also been included in this system to make it easier for traders to know the current spread so as not to get caught up in the expanding spread time which can be detrimental to you.
[spoiler title=”Read More…”]
2- Counter Trend Trader
Follow Trend Trader
1- See timeframe D2 BUY/SELL at section Supply Demand for Follow Trend
2- See BUY/SELL signal Entry or Engulfing any timeframe for entry
After you see both section Buy/SELL at Supply Demand and Entry section, you can enter position
Counter Trend Trader
1- See Rsi or Stch Level (Green for BUY) (Red for Sell)
2- See section Entry or Engulfing signal BUY/SELL for entry
After you see both BUY/SELL at Rsi/Stch and Entry section, you can enter position
* Please wait data price loading before use Entry Assistant Dashboard!
* To get the best entry must be an entry immediately after the signal comes out!
Supply Demand
Function used to identify the desired currency market direction more precisely because it uses the demand and supply formulas. The method used in this section uses a complex calculation formula based on Supply Demand. It does not use the formula to look at the common trends we see such as Moving Average, Bollinger Bands etc. to identify the direction of the market. It is also not regular a currency strength meter that measures or calculates the strength or weakness of a currency which has a weakness to identify the beginning of a trend direction and the end of a trend.
Signal Entry
This is a very important core of this system because every entry displayed is very precise and valuable. The formula used does not use the overbought / oversold formula that we usually see on social media or even in public. It uses a complex True Range secret formula to identify the most beautiful entry points. This signal entry can be combined with any technique so that confirmation can be done before making a BUY or SELL decision.
Engulfing Signal
This is an additional signal based on the candlestick. On this system it only uses Engulfing Candlestick which is so popular nowadays. The use of this section is not so much emphasized on the use of this dashboard. It is just an addition to meet this system that some traders may need.
Direction
This is a market direction using the usual indicator formula, but it is also quite effective to help us make our entry decisions. It uses 1 hour TF because to filter the trends we see in large TF to smaller TF. It is used to reduce the error of our analysis results. Most professional traders use this method to see the boundary between Uptrend and Downtrend.
ReEntry
This is an additional function placed in this system to see the bounce potential on the candlestick. It is based on the BBMA technique which is very popular nowadays.
Stochastic
One of the facilities featured in this dashboard is live stochastic value information. It is used for those who counter the trend or see at the beginning of the trend.
Relative Strength Index
In addition, one facility displayed in this dashboard is live Relative Strength Index (Rsi) value information. It is used for those who counter the trend or see at the beginning of the trend.
Spread
A spread display has also been included in this system to make it easier for traders to know the current spread so as not to get caught up in the expanding spread time which can be detrimental to you.
[/spoiler]