


The Excessive Momentum Indicator is one of the few indicators that measures excessive momentum in the financial market using price behavior. The indicator is fully developed by Young Ho Seo. This indicator demonstrates the concept and practical application of the Equilibrium Fractal Wave. Excessive market momentum can tell you about the psychology of the crowd and help you predict the direction of the price. This way, you can base your trading decisions on the detected excessive impulses. The indicator accurately identifies the places on the chart with excessive momentum. These are the places that are best suited for a deal.
The indicator has three groups of settings. Most of the time, you can use the default settings. The indicator is very easy to use, but it is a powerful tool for advanced trading.
A. Indicator Settings
- Bars To Scan: number of candlesticks to calculate the indicator
- Timeframe for Calculation: timeframe for calculating the indicator
- Momentum Strength Factor: Excessive Momentum Strength (the higher the momentum strength factor, the greater the excessive momentum strength and the fewer patterns to trade)
- Detrend Period: the period of the detrended zigzag
- ZigZag Depth: the depth of the detrended zigzag
[spoiler title=”Read More…”]
B. Graphics Settings
- Use White Chart: true – white chart, otherwise-false
- ZigZagColor: the color of the detrended zigzag
- ZigZagWidth: width of the detrended zigzag (0-hide the zigzag lines from the graph)
- Excessive Momentum Right Extension in Bar: continuation of the indicator level to the right in bars
- Excessive Momentum High Color: the color of the indicator line if C’ > C
- Excessive Momentum High Width: the width of the indicator line if C’ > C
- Excessive Momentum Low Color: the color of the indicator line, if C’ < C
- Excessive Momentum Low Width: the width of the indicator line, if C’ < C
- Fill the Momentum Triangle filling in triangles
C. Alert Settings
- Enable sound Alert: sound alerts
- Send email: Email alerts
- Send notification: push notifications
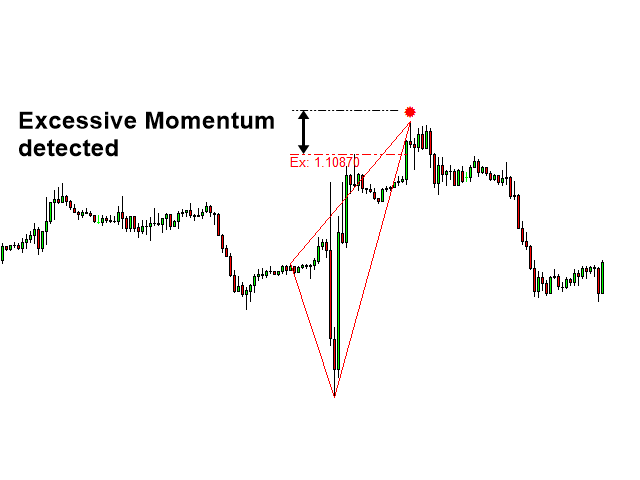
The level of the beginning of the excessive impulse is marked with a point C. The level of excessive momentum is marked with the point C’. The first turning point to the right of C’ is marked with the point D. The turning points up to point C are indicated by points A and B. Thus, the points A, B, C, and D are distributed over time. The Excess Momentum value is the absolute value of the C – C ‘ level. The opportunity for a trade appears when points C and C’ are detected for the first time. This time, your trade will be based on the C point level. Once the D point is completed, there is another opportunity to trade. Now your trade will be based on point D or C if the level is not overcome.
In the simplest case, you can use the point C and point D levels as breakout lines. Then you can add a typical Fibonacci ratio. In more advanced trading, the detected excessive momentum can be used to double confirm breakout patterns such as head and shoulders, double top, triple top, wedge, and triangle. Excessive momentum detection can also be used to improve trading on harmonic patterns.
[/spoiler]