


The Fibonacci indicator looks for the last significant impulse in a given period and draws Fibonacci levels on the chart taking into account the direction of movement and you can use this indicator to enter the market for correction or breakdown. The indicator uses a unique algorithm for finding the direction of movement by decomposing the price into wave movements.
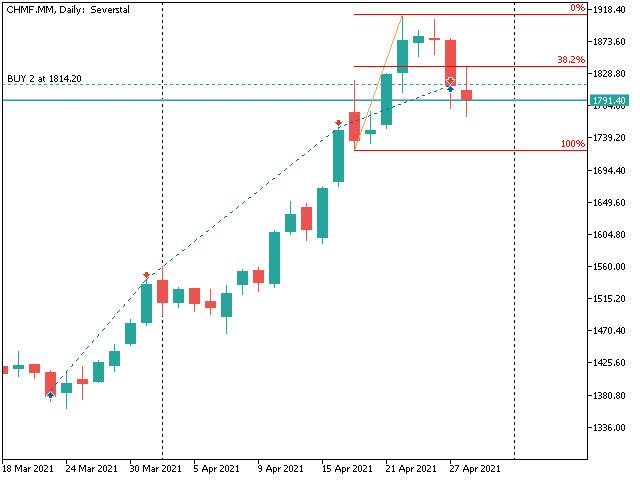
He draws the levels in a non-standard way. When an asset grows, the lower point is taken for 100%, and the upper point for 0%, so it is more convenient to consider the correction from the maximum in growth. Negative values from the point 0 are used to set the profit.
You can use the 0.100 and 38 levels as important levels for trading, we use the 38% level for entry. In the settings, you can change this level for example to 50 or any other.
This method of construction is actively used in trading on stocks and cryptocurrencies, but the method can be applied to the currency and futures markets (futures and CFDs).
Russian-language support channel in telegram
We conduct public stock trading using the method used in this indicator
An Expert Advisor has been created that trades on this FiboTrader Lite indicator
[spoiler title=”Read More…”]
A market scanner has been created that searches for signals from a list of instruments from Market Watch based on this indicator
[/spoiler]