


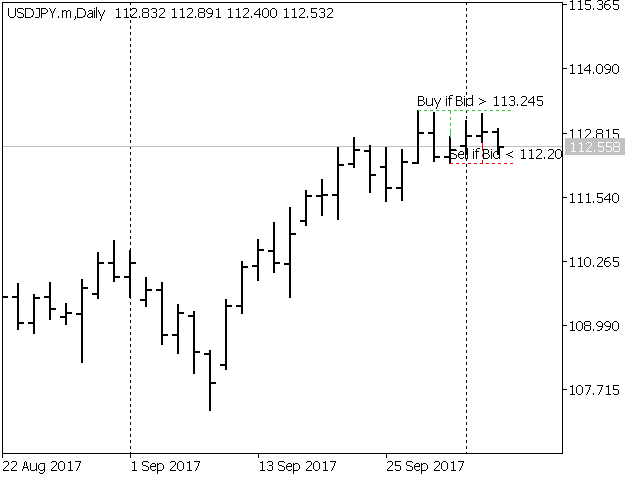

The indicator searches for and marks the “Fifth Dimension” trading signals on the chart. A detailed description of the graphical models that form trading signals can be found in Chapter # 8 “Trading with the balance line” of B. Williams ‘book” New Dimensions in Stock trading”. Signal levels indicating the price for entering a position or setting a stop loss are indicated directly on the chart. This function creates additional convenience for the trader at the time of placing pending orders. A solid horizontal line is displayed if there is a breakdown of the signal level. The dotted line on the chart indicates the level, the breakdown of which can change the market trend. The vertical dotted line is drawn from the High (Low) value of the base bar to the signal level.
- bShowLine=true-show signal lines, false-hide signal lines.
- bShowLevel=true-display prices of signal levels, false-hide prices of signal levels.
- bAlert=true-show an Alert about a breakdown of the signal level, false-turn off the signal block.
- bPush=false-send a Push notification about a signal level breakdown, false-turn off the signal block.
- bMail=false-send an email message about the signal level breakdown. false-turn off the signal block.
- BuyLevel=clrLimeGreen-select the color of the level line to buy.
- SellLevel=clrRed-select the color of the level line for sale.
- BWZoneFilter=true-enables the zoning analysis filter for the AO and AU indicators.
- MAPeriod=13-parameter of the balance line, the “Teeth” line of the Alligator indicator
- maShift=8 – parameter for shifting the balance line, the line of “Teeth” of the Alligator indicator.
- maMethod-smothed method for building a balance line (Alligator indicator jaw line)
- maPrice – median price parameter for applying balance line prices
- BWZoneFilter=true-enables the parameter for taking into account the zoning of signals based on the AO and AC indicators.
[spoiler title=”Read More…”]
The balance line shows the direction of the current path of least resistance for the price movement in the market. Therefore, it is more promising to buy when the price is above the balance line, and sell if the current price is below the balance line. The opposite signal can serve as a stop-loss level for open trades. In addition, it is more profitable to look for entry points in positions when the price is in close proximity to the balance line, and the histogram of the Awesome Oscillator indicator is located near the zero line. In this regard, it is recommended to use the Alligator, Super AO and AC indicators in the template. When trading, you should use an additional zoning filter provided in the indicator. The indicator works on all timeframes. However, the author of the strategy recommends using the daily range in trading.
[/spoiler]