


The program allows you to find the most similar areas in the past for the candle combination selected on the chart and make a forecast based on them.
Working with the application is very simple – just select the sequence of bars you are interested in on the chart (“sample”), and the program itself will find all similar areas in the past (“patterns”) and superimpose them on the current prices.
To search for the most similar “patterns” in the “Search settings” menu, you can choose one of the following algorithms:
The program supports 2 methods of combining the prices of the “sample” and the found ” pattern”:
To account for the volatility of the ” patterns “when choosing the 2nd method, and to speed up the search when choosing the 1st method, it is possible to set the minimum ratio of the standard deviation of the” sample “to the standard deviation of the” pattern ” (Min. SD ratio). The closer this ratio is to 1, the less the standard deviations of the “pattern” and “sample” prices differ.
In the “Search settings” menu, you can also set:
[spoiler title=”Read More…”]
- Program interface language (Russian/English);
- The number of bars in the “sample” and the forecast component of the ” pattern”;
- The date of the first bar in the history from which the search starts, or the total number of bars in the history;
- The total number of the closest “patterns” stored by the program during the search.
In the “View settings” menu, you can configure the graphical objects and constructions displayed on the screen. The main graphic elements are:
- Pointer to the current bar. Shows the first bar of the “sample”. In the program, when searching for “patterns”, only the open price of this bar is taken into account. For all other bars , open, high, and low prices are taken into account.
- Market profile. It is based on the forecast component of all the found “patterns”. The wider the profile, the longer the price has been at this price level.
- The maximum and minimum price line. This is the highest of all the high prices found and the lowest of all the low prices found.
- The average price line. It is built at open, high and low prices.
In the “Color settings” menu, you can select a color for all the elements displayed on the chart. For lines, you can also choose the thickness and line types.
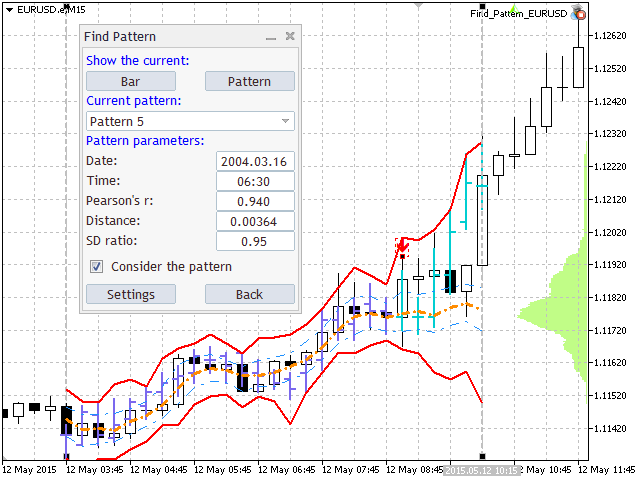
In the “Result” menu, you can go to the found “patterns” for their detailed study, and the values of all indicators defined in the program are also displayed. It is possible to exclude any of the found “patterns” from the forecast, if for some reason you did not like it.
The program itself remembers all the settings and automatically loads them when loading.
The program has many analogues:
- in the Market: 1, 2, 3, 4.
- in Code Base: 1, 2, 3, 4, 5.
[/spoiler]