


Flag Pattern pro is a Price Action (PA) analytical tool that scans the continuation patterns known as “Flag and Pennant Patterns” .
Flag and Pennant patterns are continuation patterns characterized by a move in a previous trend direction after a shallow retracement usually below 50% of the original move . Deep retracements can however be sometimes found at the 61.8 % levels. The original move is know as the flag pole and the retracement is called the flag. Read More Here
Flag and Pennant patterns are continuation patterns characterized by a move in a previous trend direction after a shallow retracement usually below 50% of the original move . Deep retracements can however be sometimes found at the 61.8 % levels. The original move is know as the flag pole and the retracement is called the flag. Read More Here
Indicator Fundamental
Fibonacci Ratios has found their validity in finance over centuries and their success in forex is nothing short of a revolutionary phenomenon . This is strongly based on the fact that the forex market is patterned around these numbers called Fibonacci ratios. Support, Resistance , Market turning points are patterned around these levels, that is why these levels should be a base in every trading system. Flag Pennant Scanner is designed to function with Fibonacci ratios, every retracement level and trade exit points are defined by the fibonacci ratios especially the 0.618 golden ratio.
[spoiler title=”Read More…”]
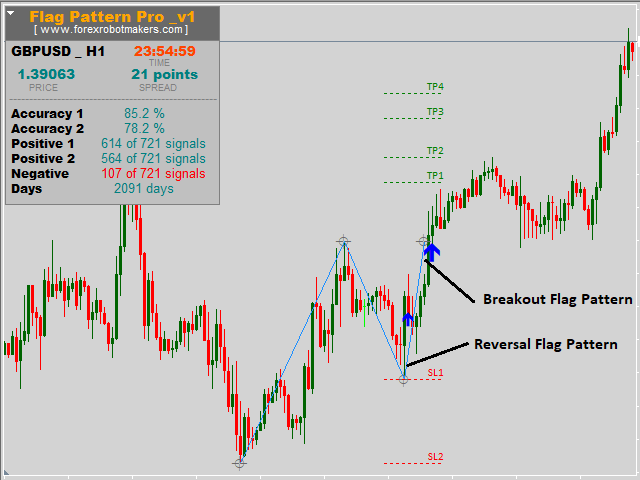
Flag Reversal Pattern
The flag reversal pattern is formed when a pull back occurs around any fibonnacci level after a slight reversal from the original trend. To ensure higher success , the default parameters of this indicator looks for pull backs around 50% to 76.4 % fibonacci which makes most pattern pull back to occur around the 61.8 % fibonacci golden ration.
Flag Breakout Pattern
The breakout flag pattern occurs when price moves and breakout the previous flag pole tip after a short reversal . The breakout patterns usually occurs after the reversal pattern but in some cases they can occur at the same time.
STATISTICS :
Accuracy 1 : This is the percentage of the times price hits TP1 before it hits stop loss.
Accuracy 1= (Total TP1 Hit /Total signals )*100
Accuracy 2 : This is the percentage of the times price hits TP2 before it hits stop loss.
Accuracy 2= (Total TP2 Hit /Total signals )*100
Positive 1 : This is the percentage of the times price hits TP1.
Positive 2 : This is the percentage of the times price hits TP2.
Negative : This is the percentage of the times price hits stop loss (SL 2) .
Days : The number of days scanned in the historical data.
SL1 vs SL2 Usage
Traditionally due to the fact that there are two patterns recognized by the indicator (Reversal