


Folding meter 4 trend lines
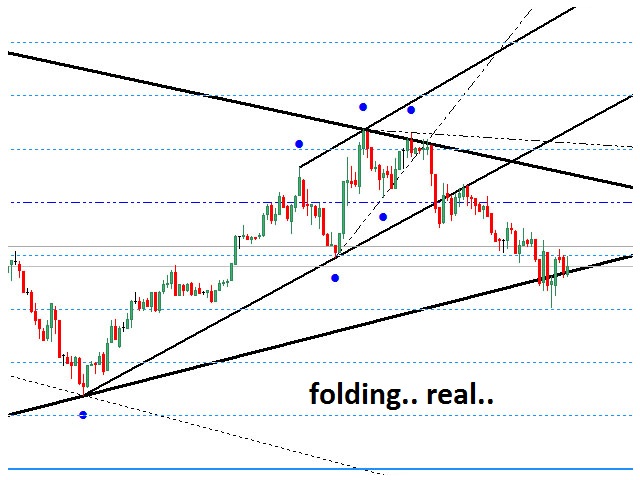
The indicator was created based on the “Folding Meter” trading strategy. Shows four pairs of inclined resistance and support lines.
The construction of these lines takes place according to the nearest High and Low of the technical indicator “Zigzag”, with four specified input parameters.
The indicator also plots points, icons above and below price extremes, which are taken to build trend lines.
The trend line indicator itself makes it easier for a trader to build trend lines, channels and technical figures (such as a Triangle, Wedge, and the like) that are formed by the price of a currency pair. Traders are actively looking for these formations on the charts and use them when working on the currency and stock markets to determine the power reserve, search for trading signals.
With this indicator, you can receive a variety of trading signals:
- Global trend and intraday trend;
- Technical figures: “Channel”, “Wedge diverging, converging”, “Triangles”;
- Determination of price highs and lows, using the built-in “Zigzag” lines;
- Visual definition of price acceleration;
[spoiler title=”Read More…”]
Folding meter is a unique pattern created from trend lines. To understand the pattern, it is necessary to notice the price movement in three or more phases, namely the emergence of a trend, its movement and active acceleration. Usually, after going through all three or four phases, the trend begins to run out of steam, which leads to a new price reversal. Of course, you will not be able to determine immediately whether a new trend has arisen, or it is just a correction. But it is possible to make money on a new reversal movement when the support trend line breaks (by default, the red line in the indicator) during an upward movement and when the resistance trend line breaks (by default, this blue line in the indicator) during a downward price movement.
Note: To learn more about the “Folding Meter” strategy, if anyone is not familiar with it yet, you can visit the Internet or printed literature on trading.
There is a possibility in the indicator:
- change the colors and thicknesses of trend lines;
- change the color of the icons indicating from which vertex or minimum these lines were formed;
- change the appearance of the highs and lows icons;
- change the color of the zigzag lines;
- the ability to disable all indicator objects on the chart;
- Show Lines 1;2;3;4 – enabling and disabling trend support and resistance lines. By default, everything is true; false; false; false.
- ExtDepth1, ExtDeviation1, ExtBackstep1 – zigzag plot parameters for the first trend lines. Default: 12,5,3.
- ExtDepth2, ExtDeviation2, ExtBackstep2 – zigzag plot parameters for the second trend lines. Default: 24,10,6.
- ExtDepth3, ExtDeviation3, ExtBackstep3 – zigzag plot parameters for the third trend lines. Default: 48,20,12.
- ExtDepth4, ExtDeviation4, ExtBackstep4 – zigzag plot parameters for the fourth trend lines. Default: 12,5,3.
- Color support trend line 1;2;3;4 – colors of trend resistance lines. Default: Blue.
- Color resistance trend line 1;2;3;4 – colors of trend support lines. Default: Red.
- Widch trend line 1;2;3;4 – Thickness of trend lines. Default: 1,2,3,4.
- Show dot building all levels – enables and disables icons for building highs and lows of trend lines. Default: true (enabled).
- Code icon dot – the code of the icons of the construction points. Default: 159.
- Widch Dot icon – the thickness of the icons. By default: 3.
- Color Dot icon – the color of the icons. Default: Blue.
- The indent of the dot – The indent of the icons from the price extremes of the construction of trend lines. Default: 20.
- Show technical zigzag – Show (show), do not show (hidden) the lines of the technical zigzag. Default: show.
- Color ZigZag – the color of the zigzag. Default: Blue.
- Width ZigZag – the thickness of the zigzag lines. By default: 1.
[/spoiler]