


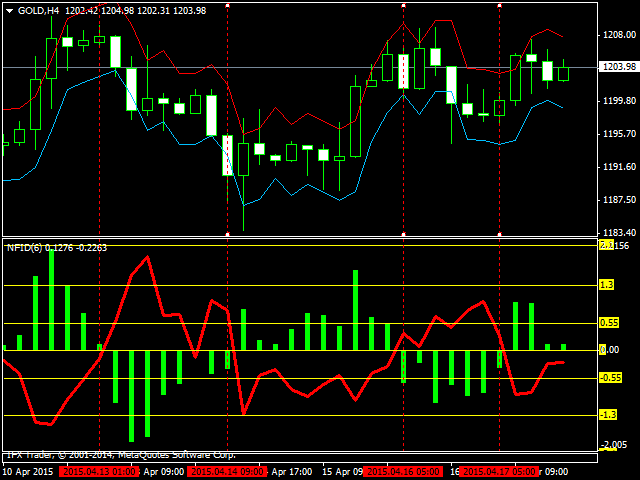

The most important thing in my system is changes in the balance of forces of sellers and buyers. This is the key idea of the whole system, and in this regard, my second FORCES-VARIATION indicator is especially important. The indicator is displayed in a separate window in the form of a green histogram and a red curve.
- The NPIuPeriod parameter is the number of bars used to calculate the change in the forces of buyers.
- The NPIdPeriod parameter is the number of bars used to calculate the change in sellers ‘ forces.
These two parameters are configured as you wish to display all changes, but the recommended value is 5.
The green histogram measures changes in the strength of buyers, and the red curve (the red histogram in the first version) measures changes in the strength of sellers.
(Changes = values and attributes).
- If the green histogram changes its sign from negative to positive (after the candle closes), the downtrend is replaced by an uptrend.
- If the red histogram changes its sign from negative to positive (after the candle closes), the uptrend is replaced by a downtrend.
An increase in the value of the green histogram means that the uptrend is still in force, while a decrease indicates that sellers are taking the initiative.
[spoiler title=”Read More…”]
Accordingly, an increase in the value of the red histogram means that the downtrend is still in force, and a decrease indicates that buyers are taking the initiative.
Just by looking at the indicator and the price movement, you can understand that this tool predicts the change of forces at the early stages, acting in the direction of the price.
Details about the system:
[/spoiler]