


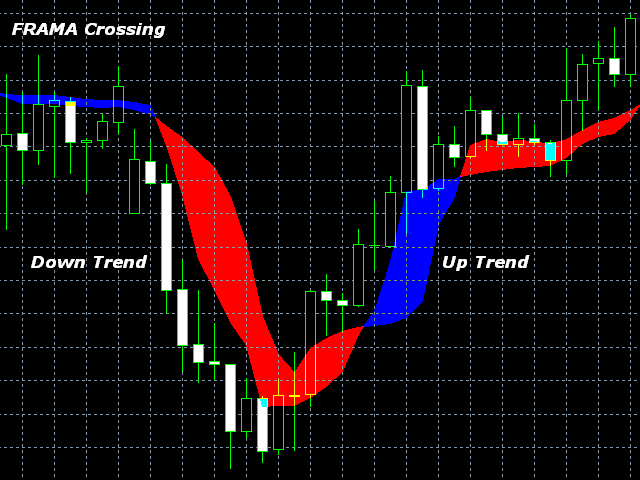

The FRAMA Crossing indicator displays two FRAMA (Fractal Adaptive Moving Average) moving averages on the chart and colors the areas of their intersection in different colors – blue (buy) and red (sell).
The advantage of FRAMA is the ability to follow strong trend movements and slow down significantly at the moments of price consolidations.
The indicator clearly determines the direction of the trend and its strength and facilitates the perception of market signals.
The indicator can work on any timeframe and will be useful in strategies where the method of crossing two moving averages of FRAMA is used.
The “Inputs” tab of the indicator allows you to select for each moving average:
- Period (Fast Period, Slow Period);
- the applicable price (Close, Open, High, Low, Median, Typical, Weighted).
The “Colors” tab of the indicator allows you to select the color, thickness, and style of the indicator lines.
- fast period – the number of bars used to calculate the fast FRAMA;
- fast applied price-choose from seven types of applied price for fast FRAMA;
- slow period – the number of bars used to calculate the slow FRAMA;
- slow applied price-choose from seven types of applied price for a slow FRAMA.