


FRX Turbo–a new indicator designed for
scalping.
An indicator that gives signals based on the readings of a whole range of standard and proprietary tools.
FRX Turbo consists of
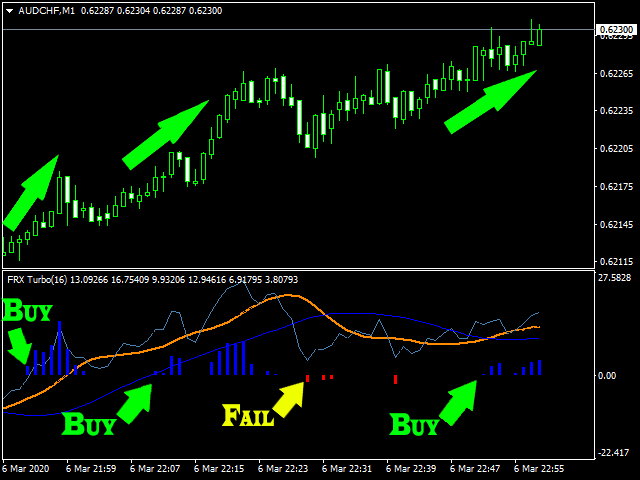
- The blue line is the RSI indicator;
- The orange line is a consolidated RSI indicator based on the T3 RSI;
- The dotted lines are the boundaries of the Bollinger bands ;( see Figure 6)
- The blue line is the middle line of the Bollinger bands;
Main features of FRX Turbo
- Easy to use;
- It has a set of indicators for filtering;
- The indicator itself shows when to enter the market;
- It has flexible settings;
- Work on any time periods;
Basic FRX Turbo Settings:
RSIPeriod-setting the blue line of the RSI;
BandsPeriod – setting the dotted lines; (see Figure 6)
BandsDeviations – deviation bands;
BandsShift-Band shift;
APPLICATION OF FRX Turbo IN TRADING:
The signal to enter the market is formed when the consolidated RSI, built on the T3 RSI, leaves the Bollinger bands. Possible
using the intersection of the T3 RSI with the median line of the Bollinger bands.
The position is entered after the first bar of the histogram of the corresponding color appears: blue – buy entry,
red – sell entry.
[spoiler title=”Read More…”]
FRX Turbo consists of
- The blue line is the RSI indicator;
- The orange line is a consolidated RSI indicator based on the T3 RSI;
- The dotted lines are the boundaries of the Bollinger bands ;( see Figure 6)
- The blue line is the middle line of the Bollinger bands;
Main features of FRX Turbo
- Easy to use;
- It has a set of indicators for filtering;
- The indicator itself shows when to enter the market;
- It has flexible settings;
- Work on any time periods;
RSIPeriod-setting the blue line of the RSI;
BandsPeriod – setting the dotted lines; (see Figure 6)
BandsDeviations – deviation bands;
BandsShift-Band shift;
APPLICATION OF FRX Turbo IN TRADING:
The signal to enter the market is formed when the consolidated RSI, built on the T3 RSI, leaves the Bollinger bands. Possible
using the intersection of the T3 RSI with the median line of the Bollinger bands.
The position is entered after the first bar of the histogram of the corresponding color appears: blue – buy entry,
red – sell entry.
RSIPeriod-setting the blue line of the RSI;
BandsPeriod – setting the dotted lines; (see Figure 6)
BandsDeviations – deviation bands;
BandsShift-Band shift;
[/spoiler]