


GARCH is short for Generalized Autoregressive Conditional Heteroskedasticity. It is a volatility forecasting model commonly used in the financial sector. The GARCH model first appeared in the work of the Danish economist Tim Peter Bollerslev (Tim Peter Bollerslev) in 1986. The 2003 Nobel Prize winner, Robert F. Engle made a huge contribution to the improvement of the GARCH model. Our GARCH INM indicator is based on the original method of constructing the GARCH model by the Nelder-Mead method. However, the original Nelder-Mead method does not take convergence into account, so we slightly improved it by adding an intermediate autoregressive Moving Average model (ARMA, Autoregressive Moving Average) before the GARCH model.
The task of the GARCH INM indicator is to improve trading. Here are some tips.
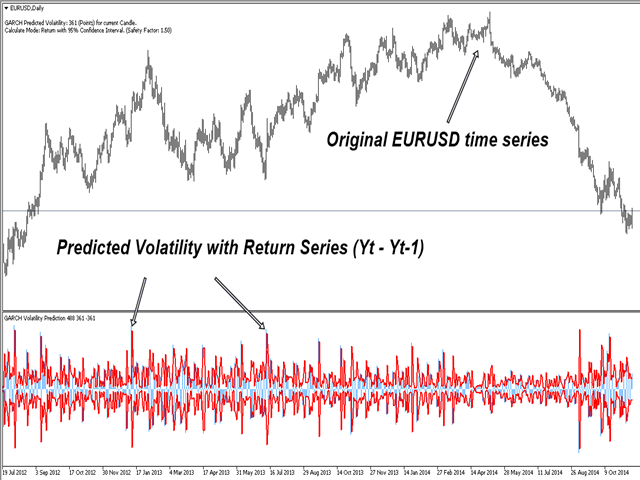
GARCH INM uses a point as the basic unit. Thus, the predicted volatility gives the trader an idea of the future volatility. For example, if GARCH predicted 1120 pips (112 pips) for the current candle with a confidence interval of 95%, then with a 95% probability the current market will remain in the range of 112 pips.
Another important function of GARCH is the detection of an abnormal market. The exit of the current market price range beyond the predicted volatility (with a confidence interval of 95%) means the occurrence of an abnormal situation, which had a 5% probability.
[spoiler title=”Read More…”]
Volatility is closely related to the trend. An increase in volatility often indicates the beginning of a trend. Using GARCH INM to filter the market, you can enter the trending market .
The GARCH INM indicator uses the standard GARCH (1, 1) model. Mathematically, it is described as the variance of a time series relative to the past values of the variance and the squares of the past values of the time series. Using mathematical notation, it can be written as follows:
Time variance t = omega alpha * square of the past value in time t-1 beta * time variance t-1
Where the return value of the time series y in t = mean value error, and t = time
- NumberOfObs: The number of observations (data points) used in the calculations. We recommend a minimum of 1000 data points.
- UseHighLow: In the High-Low (true) mode, the range is calculated using the maximum and minimum prices. If UseHighLow = false, the closing and previous closing prices are used to calculate the range. We recommend using the default value.
- ConfidenceInterval: confidence interval of the GARCH indicator. We offer 90%, 95% and 99%. The confidence interval provides a probabilistic representation of the future market range.
- SafetyFactor: The security factor provides additional protection for the trading operation. Its value must be greater than 1. If Safety Factor = 1, the predicted volatility is equal to the original GARCH volatility. If Safety Factor = 1.5, then the predicted volatility will have a 50% safety guarantee compared to the original GARCH volatility.
The GARCH indicator is an attempt to implement an advanced scientific method in a real trading application. Setting the parameters of the GARCH algorithm is a rather complex and controversial process, even for experienced statisticians. We also present the self-optimizing GARCH algorithm for analytical-minded enthusiastic traders. This program is free, so we offer limited support for GARCH Nelder Mead. Regardless, enjoy this free but powerful trading system. If the GARCH parameters are configured with an acceptable margin of error, you will get a really powerful tool for predicting volatility. The author (who is a financial engineer) has been creating trading and investment systems for several decades, using mathematical and other scientific methods.
[/spoiler]