


Professional fractal indicator. Provides a “multi-screen” mode on a single open chart.
Designed for scalpers and lovers of “accurate” inputs.
Displays fractals from six timeframes, and also displays the distances from the price to the new, nascent fractal on the lower timeframes, which provides transparency of price behavior and unique accuracy of observing the behavior of the price at the pivot points.
The indicator displays fractals simultaneously from the timeframes D1, H4, H1, M15, M5, M1.
- ShowD1 = true;
- ShowH4 = true;
- ShowH1 = true;
- ShowM15 = true;
- ShowM5 = true;
- ShowM1 = true;
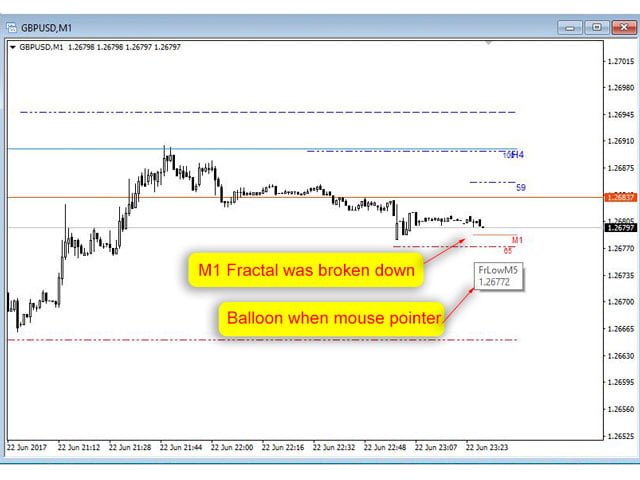
For timeframes M1 and M5, the distances from the price (Bid and Ask) are displayed in points.
If the fractal is not broken by the price , it is displayed as a dotted line. The tooltips show whether the lines belong to the timeframe.
A broken fractal is displayed as a solid line and marked with a text label indicating that the line belongs to the corresponding timeframe.
You will be able to fix an instantaneous touch of the fractal line by the price or the impossibility of breaking through this level and on the basis of this make a decision about the further behavior of the price.
Only one parameter is used as an input parameter: add or not 1 point (10 pips for five-digit instruments) to display the level of fractals.
[spoiler title=”Read More…”]
When displaying the upper fractals, the current spread is also added.
When displaying the upper fractals, the current spread is also added.
- ShowD1, ShowH4, ShowH1, ShowM15, ShowM5, ShowM1 = true; – True or False-select the required timeframes to display
- UseShift – if True, the fractal lines will move 1 point (10 pips for five-digit instruments) away from the price extremes. If False, the shift is not used. I use True. This allows you to place your stops directly behind the fractal lines.
[/spoiler]