


This indicator is designed to demonstrate the potential of cluster filters and is an appendix to the article “Creating digital filters that do not lag in time”. It contains a set of tests, thanks to which you can study the individual nuances of the behavior of such filters.
All tests are based on the Momentum indicator.
Method – method for calculating the Momentum:
- Relative Momentum – relative momentum, the calculation is done as in William Blau. Installed by default.
- Absolute Momentum – the absolute momentum, the calculation is carried out in the same way as the momentum built into the terminal.
- Price Rate of Change-calculation in the form of the ROC indicator.
All indicator lines are identical and differ only in the scale of the vertical axis. All test descriptions will be made for the relative momentum.
Max bars – the number of bars to calculate. By default, 1000.
Filter – mode of operation of the built-in cluster filter:
- Off-the filter is disabled.
- Test No. 1 Advance-filter settings for the first “Advanced Smoothing Effect”test.
- Test No. 2 Smoothing-filter settings for test number two ” Smoothing without delay”
- Test No. 3 Impulse-settings for studying the momentum impulse response.
[spoiler title=”Read More…”]
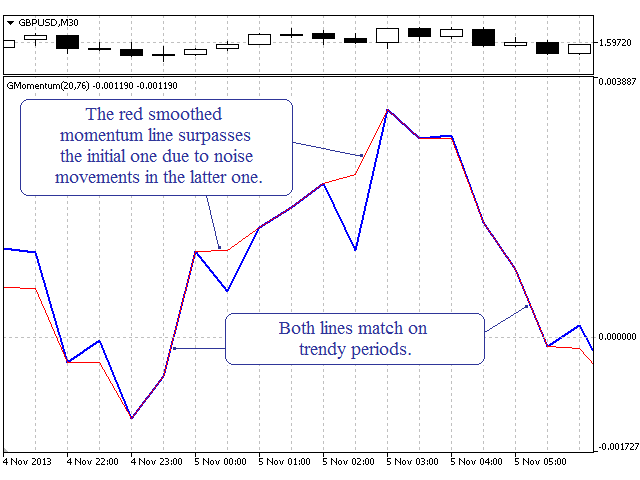
For the first demonstration, you need to set the “Filter” parameter to the “Test No. 1 Advance” mode.
The cluster filter settings for the first test allow you to often see an effect that can be called outstripping. When working in this mode, you will not see the entire initial momentum line smoothed out. The filter looks for areas where there is a chance to get a leading effect. It is not surprising that this does not always happen, but often enough that you can notice it.
The first screenshot shows one of the illustrative sections of the filter operation. It is worth noting that this is only the appearance of forward filtering. This visibility occurs solely because of the present noise movements of the most non-smoothed momentum line, and not because the filter is ahead of time.
In the first test, it was shown that when the initial momentum line is wrong (noisy) against the trend, this leads to the effect of outperforming the original line with a smoothed line. It is obvious that the momentum line can also be wrong in the other direction, that is, it can unexpectedly slip far in the direction of the trend, and even indecently linger there for a long time, although the trend has already turned around. It would be logical if the filter starts to slow down such movements.
You can see how the algorithm works when filtering such errors that are ahead of the trend. To do this, when starting the indicator, you need to set the “Filter” parameter to “Test No. 2 Smoothing”. The operation of the cluster filter during this test is divided into two parts.
In the short indicator name ” GMomentum (Parameter 1, Parameter 2)”, displayed in the chart subwindow, there are two parameters in parentheses. If the second parameter is -1, then an attempt is made to correct (smooth out) errors that are ahead of the trend. If the second parameter is equal to or higher than zero, then the settings are connected to get advanced smoothing. Use the Up and Down buttons on the keyboard to change the sensitivity of the filter.
The second screenshot shows that, despite the sharp movements of the price and the initial momentum line, the smoothing of the momentum line occurs without delay. With sufficient smoothing, we get acceptable entry points.
By the way, flat areas are the trouble of most indicators. Here, even with these settings, some of them easily degenerate into almost a straight line. Theoretically, using this technique, you can improve any of the existing indicators without creating additional lag.
Studying the characteristics of momentum with a built-in filter can be very interesting. For example, the impulse response demonstrates well how and where the peaks on the momentum line disappear when using the settings for the second test. For the third test, you need to set the “Filter” parameter to “Test No. 3 Impulse”. During the test, a single pulse is applied at each 1024 bar. After the indicator starts, find this moment on the chart. It should look as shown in the third screenshot.
When the indicator starts, the filter is disabled. So you will see two peaks on the blue and red line. One peak will be at the moment of a single pulse and equal to it, the other is directed in the opposite direction after the specified number of periods. This is exactly what the impulse response of the “naked” momentum looks like. Then, using the Up and Down buttons on the keyboard, gradually increase or decrease the sensitivity of the filter.
You can see that the filter gradually eats the second peak under the root and does not touch the first one at all. The filter completely corrects what the momentum has done and exactly recreates the original picture: a single pulse in a clear field. There is no lag. There is no distortion of the amplitude of a single pulse and its shape. What’s it? How does the perfect filter work?
For more information, see the article “Creating digital filters that are not time-delayed”.
[/spoiler]