


Why do you need it? Looking through the results of my favorite Expert Advisor in the strategy tester, I noticed that the trades opened by the Expert Advisor in the Asian session are mostly unprofitable. It would be nice to see on the chart why this is happening – I thought. And then I ran into the first problem – how to see only the Asian session on the chart? And hide everything else if possible? Finding the opening hours of exchanges in Tokyo and Singapore is not a problem, but how to highlight only this time and no other on the chart?
The second problem appeared a little later – for some reason, all trades opened by the Expert Advisor on Thursday turned out to be unprofitable, and on other days of the week everything was fine. What was going on on Thursdays that my adviser couldn’t handle? I started to figure it out, and I needed to highlight all the Thursdays on the chart. And that was the second problem.
The third problem occurred when I decided to compare the price behavior from two different trading sessions. It seemed to me that the American session is somehow connected with the Asian one in a special way, and I needed to highlight two trading sessions, removing everything else. And that was the third problem.
After comparing these problems with each other, I realized that I needed to act, and I started working on an indicator that would solve all these problems. This is how the GoodTime indicator turned out.
[spoiler title=”Read More…”]
GoodTime:
- highlights arbitrary time intervals, such as trading sessions;
- it can highlight only the selected day of the week, for example, Thursday;
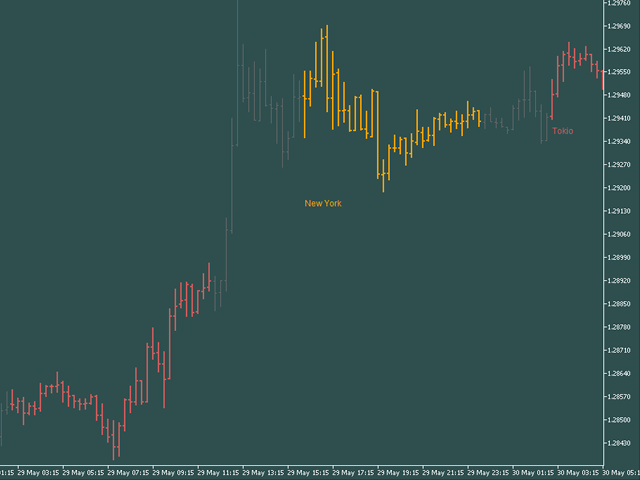
- signs each highlighted section, for example, “Tokio THU”;
- highlights bars, candles and lines, automatically following the switching of the price display mode on your chart;
- highlights the selected intervals with a vertical fill;
- or underline;
- or, it finds the maximum and minimum price values at the specified time and highlights the space from the minimum to the maximum price of the interval.
Many GoodTime indicators can work on the same chart at the same time, highlighting different intervals. Thus, you can highlight two trading sessions and compare them with each other.
GoodTime can be used when creating reports and screenshots, to draw attention to the selected bars or candlesticks of the chart. It can be used in the analysis of Expert Advisors, highlighting trading sessions and days of the week on the chart for their subsequent careful analysis.
GoodTime is also suitable for manual trading, highlighting the working hours of colleagues from other time zones, as well as common trading sessions.
You can always download the demo version of the indicator before purchasing.
Follow the trends, and may luck be with you!
[/spoiler]