


If you have the opportunity to read the book “Trend Trading – A Seven-Step Approach to success” by Daryl Guppy, you will have a great deal of information about how to “read” the market. In his book Daryl show, among other things, how can we use a visual tool to measure the volatility and trend between Long and Short-term periods: The GMMA – Guppy Multiple Moving Averages.
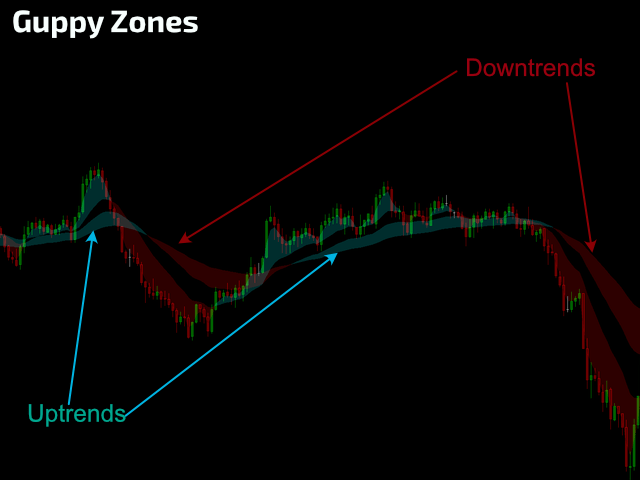
Instead of using his original idea of having 12 Exponential Moving Averages in your chart – which could be very CPU-demanding if you have more than 1 chart opened in your computer – we decided to rewrite this idea and transform it into just a simple Filled-area but preserving all the calculations of the original idea. So, welcome to Guppy Zones.
Daryl’s book was based on Daily Charts, and the settings of his GMMA were also based on daily periods, so, for the Short-term periods he used: 3,5,8,10,12 and 15-day Exponential Moving Averages, and for the Long-term periods he used: 30, 35, 40, 45, 50 and 60-day EMAs. You can play around with the values on the settings of Guppy Zones, as it is very important to calibrate ANY kind of indicator to your needs (Symbol, Timeframe, and Strategy).
- Guppy Zones will show you areas of Dynamic Support and Resistances.
- Combining the reading between the Short and Long-term zones will provide you with more confidence about where the market is “going”.
- Combining also the dynamic Support