


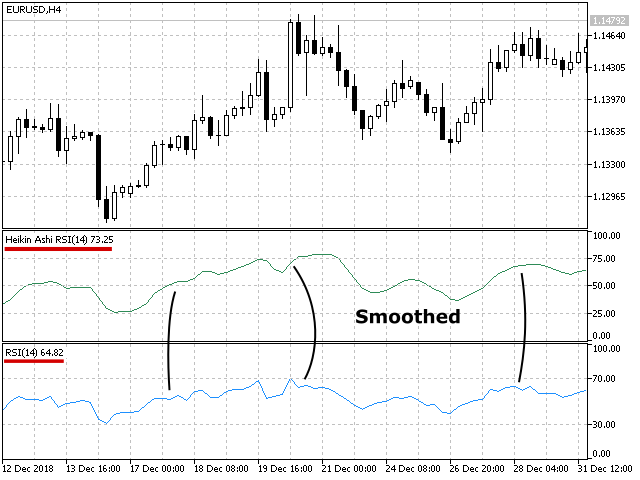

Heikin-Ashi RSI is a technical indicator, combined Heikin-Ashi and RSI calculations, to show price moving trend and reversal.
The Heikin-Ashi technique – meaning “average bar” – can be used to spot trends and to predict future prices. Heikin-Ashi Candlesticks are based on price data from the current open-high-low-close, the current Heikin-Ashi values, and the prior Heikin-Ashi values.
The relative strength index (RSI) is a technical indicator used in the analysis of financial markets. It is intended to chart the current and historical strength or weakness of a stock or market based on the closing prices of a recent trading period. The RSI is classified as a momentum oscillator, measuring the velocity and magnitude of directional price movements. Momentum is the rate of the rise or fall in price.
This indicator uses Heikin-Ashi Close prices to calculate The relative strength index (RSI), and uses Exponential moving average (EMA) technique to smooth output.