


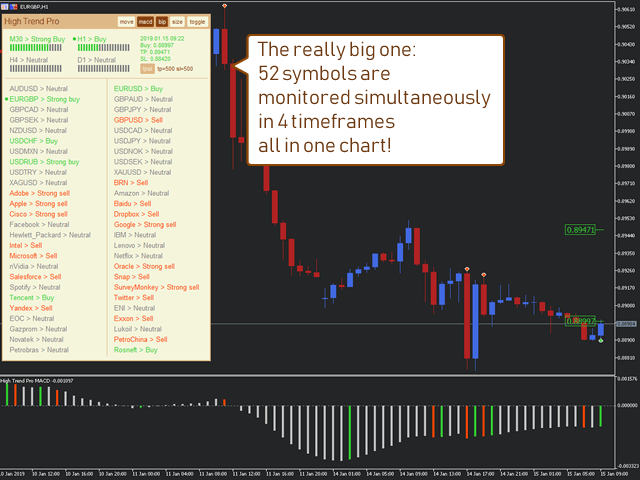

The High Trend Pro indicator (high trend, professional version) monitors a large number of symbols on 4 timeframes
simultaneously and determines the signal strength. The indicator tells you when the signals match on different timeframes. In this case
, the indicator can be run on a single chart. Thus, High Trend Pro is a multi-currency and multi-time frame
indicator.
High Trend Pro uses redesigned versions of popular and in-demand indicators to determine signal strength.
High Trend Pro calculates the signal strength for all selected symbols. Click the symbol button in the indicator interface
to quickly display the signal strength for all selected timeframes (maximum 4 timeframes).
all characters. In the future, the indicator works normally with all symbols.
It is recommended to make a trade when the signal is confirmed by at least two timeframes. At this point, the indicator reports that
a Super buy (super buy) or Super sell (super sell) signal has been formed).
Other signals generated by the indicator: Strong Buy or Buy (strong buy and buy), Strong Sell
or Sell( strong sell and sell), Neutral (neutral position) and Loading (data loading). These signals
can change quickly, especially on small timeframes. That is why a strong signal is considered to be confirmed on at least two
timeframes.
[spoiler title=”Read More…”]
The indicator can notify you of a strong signal with a beep sound and push notifications to your smartphone.
1.I recommend the signals of two timeframes – H4 and D1.
2. The signal should be Super buy or Super sell, as a result of the coincidence of these two timeframes.
3. The signal should be at the beginning of the smallest timeframe, i.e. the first 1-2 hours of the 4-hour timeframe. If the signal appears in 3-4 hours
4-hour timeframe, it is better to skip it.
Color preset – color scheme.
Fontsize – the font size.
Push – the number of minutes for notification to the smartphone. Zero to disable. Set up push notifications in the Tools menu >
Settings > Notifications”.
Symbols source – the source of symbols: Market_Watch (market overview) and Custom_List (custom list). For the first
option, the indicator monitors and displays information on all symbols launched in the market overview. For the second option – for those characters
that are separated by commas in the Symbols custom list parameter.
Symbols custom list – a custom list. Specify the comma-separated characters that are used to display information and
check the signal strength. Set the Custom_List value for the Symbols source parameter.
Timeframe 1 – timeframe 1.
Timeframe 2 – timeframe 2.
Timeframe 3 – timeframe 3.
Timeframe 4 – timeframe 4.
Global stoploss – the minimum distance from the price, after which the indicator searches for the stop loss level at the nearest extremes
on the current chart (pips).
Global takeprofit – the minimum distance from the price, after which the indicator searches for the level of takeprofit at the nearest
extremes on the current chart (pips).
move-click and hold to move the panel. Not available in test mode.
macd-enables the output of the main MACD indicator. The indicator signals strong signals (red and green bars) on the
current timeframe. Only the indicator panel shows the actual signal strength.
bip-enables an audio notification.
size-changes the size of the panel. Only the extended panel shows the prices of the strong signal in the upper right corner and the levels of these
prices on the current chart.
toggle-collapses / expands the panel.
tpsl-opens a panel for specifying stops for a single symbol.
Click any symbol in the panel to display information on the running timeframes at the top of the panel. The dot on the left – the upper part of the panel
displays information on this symbol. Not available in test mode.
Click the timeframe at the top of the panel to go to the chart of this symbol and timeframe. The point on the left is the current graph. Not available in test
mode.
[/spoiler]