


The HHHC-LLLC indicator uses candlestick analysis based on the principle of confirming the trend for (bullish) candles with a higher high (Higher High) and a higher closing price (Higher Close) and for (bearish) candles with a lower Low (Lower Low) and a lower closing price (Higher Close). The indicator does not lag, does not redraw, does not use averaging.
HHHC-LLLC helps to confirm:
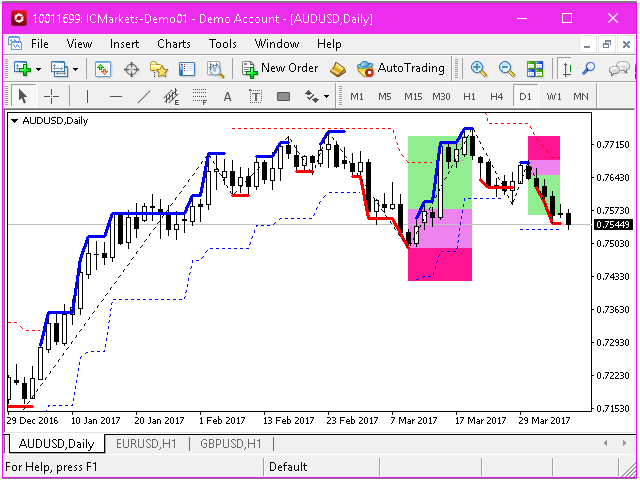
- market structure and levels-look to the left to see how they line up
- trends, pullbacks, and reversals
- Bullish moves (blue), bearish moves (red)
- Structural Zigzags (black dotted lines), to generalize the market movement
- depletion and fading (lines become flat) – for predicting reversals and continuations
- continued
- break through levels
- consolidation
- zones of attenuation of the continuation of the trend.
- the trailing stop – select the type of
It works on any market and timeframe. The movements alternate from bullish to bearish. Even a short rollback and continuation are shown accurately. View other timeframes to see trends, consolidations, and structural levels. This will allow you to quickly make trading decisions based on facts.
Area of attenuation of the trend continuation:
[spoiler title=”Read More…”]
On the basis of trend movements and pullbacks, potential zones of damping of the continuation of the trend are determined. Draw 3 zones: pink, green, and red.
In a trending market, if the price action rolls back into the pink zone and there are valid entry prerequisites, such as LLLC in the pink zone in a bear market, then the green zone represents the previous trend lows, and the red zone represents the potential stop loss level (based on ATR). In this case, it turns out that the green zone of the goal corresponds to the pink plus red zone as 1:1.
Each time frame will show the fade zone in accordance with the trends and pullbacks on this time frame.
You can use other filters to apply your own entry rules to improve your results, but the zones are drawn based on market movements. They can be useful when trading on the continuation of the trend. Of course, before real trading, it is necessary to test this tool. To support testing on the history, this indicator provides the ability to display all past fading zones.
- HHHC line colour [Blue] – the bullish movement
- LLLC line color [Red] – bearish movement
- HHHC-LLLC line style [Solid] – line style: solid, dotted, etc.
- HHHC-LLLC line width [3 pixels] – hide the line or set the width from 1 to 5 pixels
=Stops=
- Trail stop type [HEIKEN_ASHI_PLUS_POINTS_TRAIL_STOP] – trailing options: NO_TRAIL_STOP (disabled), ATR_TRAIL_STOP (using the ATR period), or WICK_PLUS_POINTS_TRAIL_STOP (based on upper / lower extremes). Heiken Ashi Trailing Stop uses Heiken Ashi Virtual Candlesticks
- Trailing stop line style [Dot] – the style of the trailing lines.
- Trailing stop line width [1 pixel] – hide the line or set the width from 1 to 5 pixels
- Typical Spread Points [15] – used in the trailing stop function to determine whether a stop level has been reached by a price action
- ATR period for ATR trailing stop [7] – ATR period for the ATR trailing stop function and the ATR trailing stop function for the attenuation zones
- trailing stop points [50] – setting for trailing on extremes and Heiken Ashi candlesticks
=Kill Zones=
- Show the Kill Zones (pink/green/red) [false] – displays the trend continuation fading zones
- Show only the latest Kill Zones [true] – show only the latest bullish and bearish zones or all zones on the history
=Zig Zags=
- Show Structure Zig Zags [true] – displays the zig zag between the vertices of successive HHHC and LLLC movements
- Zig Zag line color [Black] – color
- Zig Zag line style [Solid] – line style.
- Zig Zag line width [2 pixels] – hide the line or set the width from 1 to 5 pixels
- Draw the Channel lines [true] – displays the channel lines between the upper vertices (upper channel) and the lower ones (lower channel)
- Channel line color [Gray] – color
- Channel line style [DashDot] – line style.
- Channel line width [1 pixel] – hide the line or set the width from 1 to 5 pixels
=Display=
- Show 1 point gap [true] – show a gap of 1 point, allows you to see the exact levels on the graphic objects of the fading zones when you zoom in on the graph.
- Treat EqualHHC as HigherHHC and ELLC as LLLC [true] – HHHC is a candle with a higher high and closing price than the previous candle. With [false], a clean approach is used. When [true], candles with highs equal to the highs of the previous candle, but with a closing price higher than the previous candle, will be considered HHHC candles. Bearish movements with equal lows and a lower closing price are considered as LLLC.
[/spoiler]