


The panel is designed to detect breakouts of higher Low/lower High and “Triangle” patterns on 28 currency pairs and up to 8 timeframes simultaneously.
The numbers on the left are the normalized values of the distance between the price and the last higher High and lower Low, if they have formed (if they are absent, “–“is displayed). The text will turn red when a higher Low is broken and green when a lower Highis broken, if the breakout distance is greater than the value of the Signal_Var variable for this timeframe.
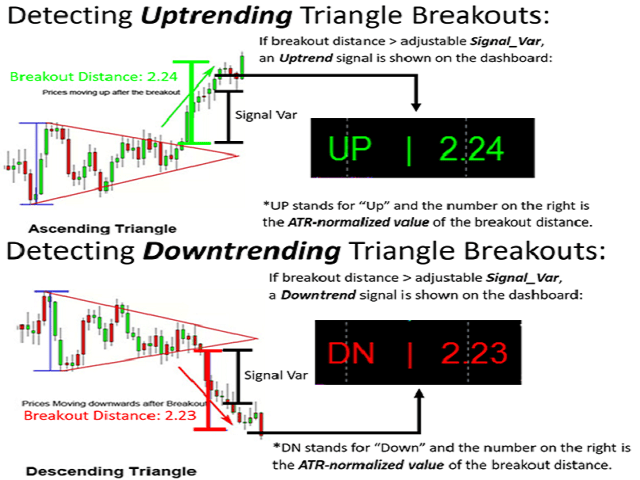
The middle columns display“The “Triangle” rating of each timeframe and symbol-a score of 2 means that the “Triangle” model has been formed (for more information, see the screenshots).
The right columns show whether the price is above or below the EMA of the configurable time period (external variable EMA_Period).
- X_Signal_Var: The minimum distance that the price must travel above the value of the last lower High or below the value of the last higher Low in order to display a red or green signal on the X timeframe.
- Show_M5/M15/M30/H1/H4/D1/W1/MN1: Show columns for the selected timeframe.
- EMA_Period: The EMA period for the columns on the right.
- The indicator colors are the colors of the placemarks and columns.
- Safe_Mode: Runs the indicator in “safe mode”, avoiding symbols and timeframes for which data may be missing.