


The Honest Predictor (iHP) indicator predicts the direction of the trend until a certain expiration time (“expiration time”). It is well suited for working with binary options. Main features:
- “Honest” statistics on the level of reliability of forecasts.
- Not redrawn, not recalculated. The indicator is stable and is calculated only on closed bars (not on ticks).
- The results of the positions are measured at the actual closing prices.
- The product is based on the technical indicator RSI within the multi-timeframe confirmation strategy.
The indicator is optimized to work on H1. The best results were achieved with an expiration time of 1 to 3 bars (i.e. 1 to 3 hours).
Basic parameters
- Duration of backtesting in days: the length of the history (in days) on the chart to assess the accuracy of the indicator (=percentage of profitable positions), the statistical level of reliability and visual analysis.
- Indicator threshold: the minimum threshold value for generating an alert.
- Expiration Time in bars: The estimated expiration time for binary options offered by the indicator.
The default value for the duration of testing on the history is 30 days, so that the positions are sufficient for a statistically adequate assessment of accuracy. However, the user should try to reduce it to get the most relevant statistical values, and at the same time not to bring the number of positions to too low a value, at which the forecasts become too unreliable (poorly reliable or unreliable, see below). In the latter case, no alerts are generated. Such conditions can also occur when the accuracy approaches a” random ” value of 50%.
[spoiler title=”Read More…”]
To improve accuracy, adjust the Indicator Threshold (0-10) and Expiration Time parameters in bars (usually 1-4).
Try out the demo version before you buy! Test it on the instruments and with the parameters specified in the table below (timeframe: H1, 30 days of testing on the history).
Working with a schedule
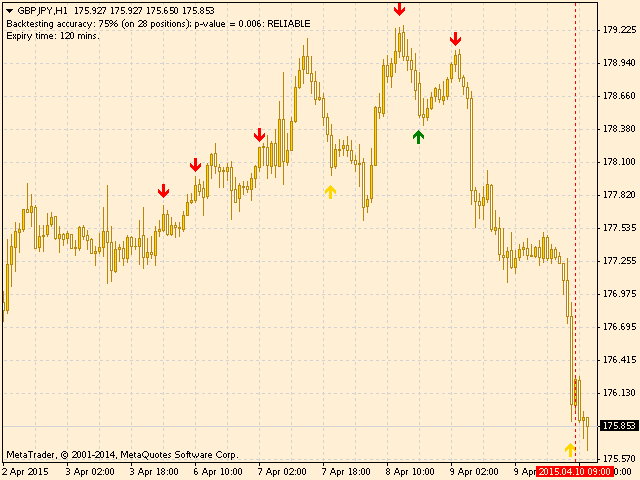
On the chart (see screenshots) and during the testing period on the history (delimited by two vertical lines), the down (red) and up (green) arrows indicate the predicted PUT or CALL positions, respectively, that were successfully executed during the expiration period (profitable options, in-the-money positions). Yellow arrows indicate unfulfilled forecasts (unprofitable options, out-of-the-money). Of course, positions opened very recently cannot be checked until they have entered the period of testing on the history after the expiration date.
The calculated accuracy value and the p value are displayed in the upper-left corner . Both values are constantly updated.
ATTENTION: since the strategy is multi-timeframe, alerts are displayed with a certain delay after the closing time of the last formed bar.
Always pay attention to both the issue time and the expiration time of the position indicated in the alert!
ATTENTION: since the strategy is multi-timeframe, alerts are displayed with a certain delay after the closing time of the last formed bar.
Always pay attention to both the issue time and the expiration time of the position indicated in the alert!
A binary option can be either successful or not. From a statistical point of view, it can be considered as a binomial random variable. This allows you to determine the statistical level of reliability of the indicator in predicting changes in the price of the instrument at the current expiration period. The level of reliability can be quantified using the so-called p value. p shows the probability that the same value can be reached by chance. That is, the lower it is, the more reliable the indicator forecasts are.
Usually, at p>0.1, the indicator forecasts should be ignored (fully unreliable); at 0.05 < p < 0.1 they are considered not very reliable (poorly reliable, high risk), at p < 0.05 they are moderately reliable and at p < 0.01 – reliable (reliable).
In addition to the accuracy calculated on a user-defined historical period, iHP also defines the p value as an indicator of the reliability of the calculated accuracy value.
Thus, the user gets a clear idea of the “risk level” and can assess the reliability of the indicator’s forecasts.
[/spoiler]