


Universal adaptable indicator.
Based on the available historical and real data, it determines the expected trading range for the current day and shows the area of probable pullback of quotes on the chart. All this is due to the built-in algorithm, which itself adapts to different models of market quotes behavior. The indicator, with the selected settings, shows its effectiveness on most currency pairs, which during the trading day or the next day make a rollback from the reached extremes. Such tools are in particular crosses and some basic pairs.
- Does not redraw;
- Minimum of configuration parameters.
- day_range – average value of the effective trading range for a particular pair;
- Period_N – the number of days for data collection;
- Bars_to_draw – number of bars in addition to period_n;
- Line_width – line thickness;
- Color_line_up – color of the HIGH line;
- Color_line_down – color of the LOW line;
- Color_rec_up – color of the shaded area above the HIGH line;
- Color_rec_down – color of the shaded area below the LOW line;
- Font_size – the font size;
- Font_color – the font color for HI to LO;
- Font_ancor – location of information on the screen;
- ID – the magic number;
[spoiler title=”Read More…”]
It should be remembered that each currency pair has its own behavior. Therefore, initial settings are set for each pair. Further, the indicator itself will adapt to constantly changing market conditions.
You can download ready-made settings for EURUSD, USDJPY, EURCHF, CHFJPY, GBPUSD, AUDUSD, EURAUD or choose your own.
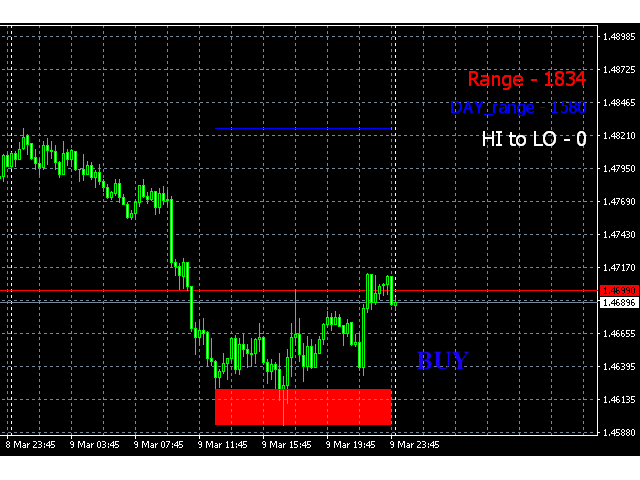
- Range – the estimated daily range;
- day_range – average value of the effective trading range for a particular pair;
- HI to LO – the current number of points between HIGH and LOW.
Set the chart to M15. The indicator starts working from the moment it is installed on the chart and analyzes the incoming data in real time. When the price reaches the limit of the calculated daily range (Range), the indicator will draw lines on the boundaries of the range and paint over the area where you can make transactions in the opposite direction during the current and subsequent days.
If the Range value is less thanday_range, it becomes a priority, and the lines on the graph are drawn by the day_range value .
For those who bought this indicator, I can make additional settings for other pairs if necessary, as well as for those who are interested in this type of trading, I will tell you in more detail how to use it better.
[/spoiler]