


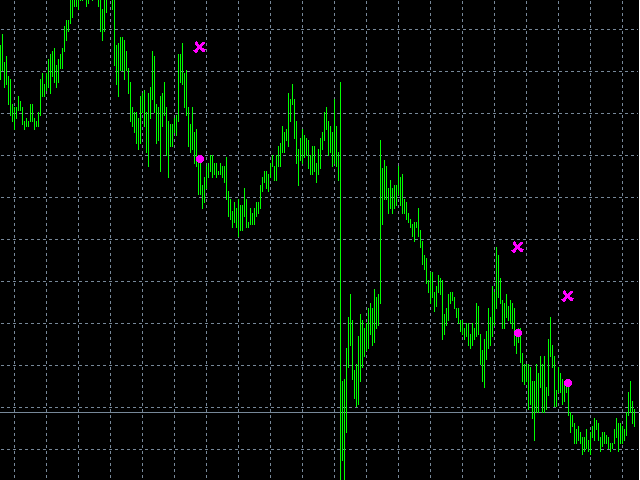

The indicator displays the signals of the intersection of the Tenkan-Sen and Kijun-Sen lines of the standard Ichimoku Kinko Hyo indicator on the chart. A buy signal is formed when the Tenkan-Sen line crosses the Kijun-Sen line from the bottom up, while both of them are above the Senkou Span A line. A sell signal is formed when the Tenkan-Sen line crosses the Kijun-Sen line from top to bottom when both of them are below the Senkou Span A line. The stop loss level on the Senkou Span B line is also indicated. Additional filtering is used based on the data of the older time interval. For a buy signal, the Senkou Span A line should be above Senkou Span B, and for a sell signal, it should be the opposite.
The indicator does not display the standard Ichimoku lines. In the screenshots, they are given to explain the principle of signal generation.
- Tenkan_Sen, Kijun_Sen, Senkou_Span – parameters of the Ichimoku indicator of the same name;
- SlowTF – time interval for filtering the signal (drop-down list). If filtering is not required, then you must select PERIOD_CURRENT.