


Indicator to Identify the Trendusing fairly simple, but robust filtering techniques (based on the moving median algorithm XM) and more complex developed by the author, algorithms (XC, XF, XS, four species not lagging moving averages SMAWL, EMAWL, SSMAWL, LWMAWL), together with complementary methods of cluster filtering (multi-cluster analysis is used for more reliable identification filatovich plots), allows a very precise and, most importantly, with low latency to install:
(1) the beginning of a true trend movement, as well as (2) to identify a flat, which can be used both for trading using scalper strategies and when using long-term trading strategies.
(1) the beginning of a true trend movement, as well as (2) to identify a flat, which can be used both for trading using scalper strategies and when using long-term trading strategies.
The averaging algorithms of the indicator, with the exception of the algorithms of non-lagging averages, which are the author’s KNOW-HOW, are presented in detail in the last screenshot.
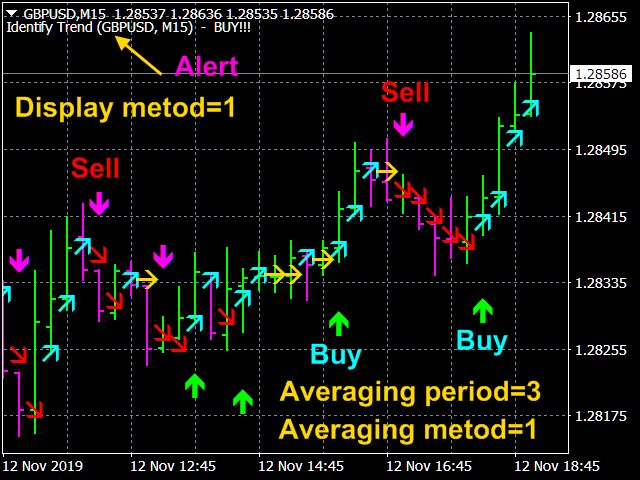
The indicator readings are clear, extremely simple and do not require comments. The blue line of the indicator marks an uptrend, the gold line is a flat, and the red line is a downtrend. Accordingly, the entry points for Buy when the red or gold line is replaced by blue, and for Sell – on the contrary, when the blue or gold line is replaced by red.
[spoiler title=”Read More…”]
Possible moments of changing the direction of price movement are also marked with arrows, which are never redrawn under any circumstances. The indicator has all kinds of alerts. The alert is activated when the indicator’s indications match (for the direction of the trend) on the last two bars.
Indicator settings.
- Price type – The type of price. Values: Close price, Open price (default), High price, Low price, Median price ((high low)/2), Typical price ((high low close)/3), Weighted price ((high low 2*close)/4).
- The averaging method is an averaging method. Values: XC=XF – XS SMMA, XF=
*SMMA, XS= - The averaging period – The averaging period. Any integer (3 by default).
- The display method – The method of displaying information. Values: Show only arrows (default),Show lines and arrows, Show only lines.
- Line (arrows) thickness. The thickness of the lines (arrows). Any integer (2 by default).
- Trend DOWN line color=Red – The color of the downtrend line.
- Trend UP line color= Aqua – The color of the uptrend line.
- FLAT line color=Gold – The color of the flat line.
- Trend DOWN arrow color=Magenta – The arrow is the beginning of a downtrend.
- Trend UP arrow color=Lime – The arrow of the beginning of the uptrend.
- The Signal method is a type of notification about a trading signal. Values: No, Send alert, Print (in expert), Comment (in chart), Sound Print, Sound Comment, Sound, Push Comment, Push, Mail Comment, Mail.
[/spoiler]