


Imagine a support tool that Colors Up the candlesticks on your chart according to the market behavior, based on Trend, Momentum, Price Behavior, and/or Volume. You choose what to use!
Well, welcome to the Minions Labs creation called Impulse Detector!
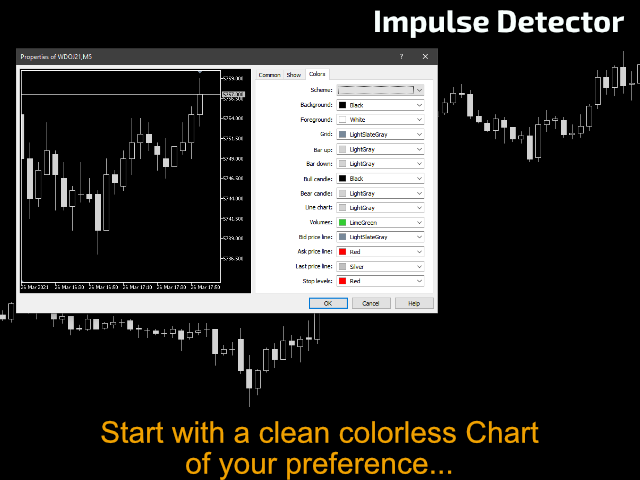
This flexible indicator is designed to give visual support on your chart using just colored candlesticks, so you can continue to draw your studies, use any other indicators in auxiliary sub-windows without affecting your screen real state.
It doesn’t matter if you are a novice or intermediate trader, the Visual aids provided by the Impulse Detector will help you determine the proper state and mood of the market based on your personal calibrations and needs. This indicator is fully customizable in every aspect, so you can get exactly the read that you expect from the Market, Timeframe, and Strategy you are trading.
- Analysis #1 – TREND – Exponential Moving Average over Price. Monitors when the EMA is pointing upwards or downwards, then your candles are painted accordingly.
- Analysis #2 – MOMENTUM – For this analysis, we used the very well-known OSMA indicator. The candlesticks will Light Up when the OSMA is upwards/downwards and it is above/below its Zero-Line.
- Analysis #3 – PRICE BEHAVIOR– For this analysis, we used another Minions Labs’ (free) indicator called Price Momentum. So, when Price Momentum is above/below the configured thresholds, the candlesticks will Light Up.
- Analysis #4 – VOLUME STRENGHT – And finally, you have the option to use the Volume analysis to your benefit. When the volume for each candle surpasses the established threshold, that candle will be Lighted Up.
[spoiler title=”Read More…”]
You can choose any of those analyses above, AND, also combine them the way you need, having the combination option up to 15 types of analysis. With this arsenal of analysis tools you can build a very powerful visual reference for your trading strategies without bloating your interface with tons of lines and on-screen indicators.
Please see the attached videos and screenshots for the Calibration process and full details.
- Data Analysis Method to use – Trend, Momentum, Price Behavior, Volume, OR, any combination of these techniques (15 in Total).
- Trend Analysis – Price Type to use in calculations Period of analysis.
- Momentum Analysis – Price Type to use Period of analysis Long period MA Smoothing level
- Price Behavior Analysis – Period of the analysis Overbought