


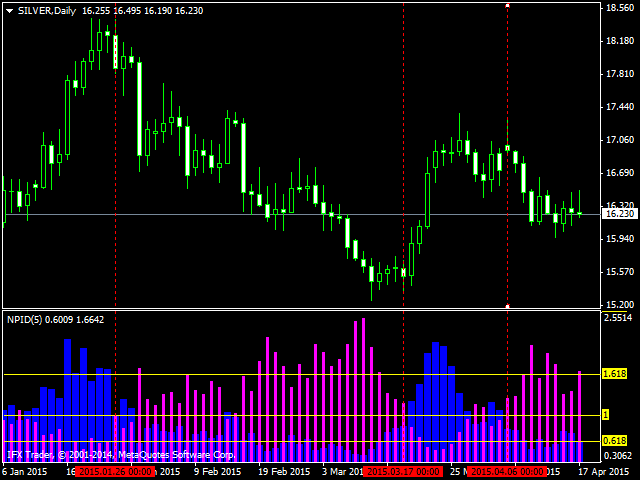

The indicator compares the strength of sellers and buyers in the market. The relative strength of buyers is represented by a blue histogram, and sellers – by a pinkone . This way you can see which side is currently dominating the market.
The indicator works on gold levels (0.618, 1.618, 2.618…).
Equilibrium (equilibrium) between two opposite forces occurs when the indicator is very close to the value of 1.0. This means that the market is in flat.
With an imbalance of forces, their values move away from 1 in both directions.
Overbought and oversold levels:
- If the blue histogram falls below 0.618 (and even more so 0.382), the price is in the oversold zone.
- If the pink histogram falls below 0.618 (and even more so 0.382), the price is in the overbought zone.
Note: Changes in the balance of forces are a key element of the system. In this regard, the second indicator, designed specifically for tracking them, is especially important. I called it FORCES-VARIATION. The indicator has the form of a red line and a green histogram (see the video).
Note: Changes in the balance of forces are a key element of the system. In this regard, the second indicator, designed specifically for tracking them, is especially important. I called it FORCES-VARIATION. The indicator has the form of a red line and a green histogram (see the video).
[spoiler title=”Read More…”]
Details about the system (in English) can be found here:
[/spoiler]