


iVolX 2 DPOC-dynamic horizontal volume indicator for any time periods
- VolumeSource-selection of data for volumes (tick or real)
- DPOCOn – enabling / disabling the indicator
- DPOCFrom – start date of calculations
- DPOCTo – settlement end date
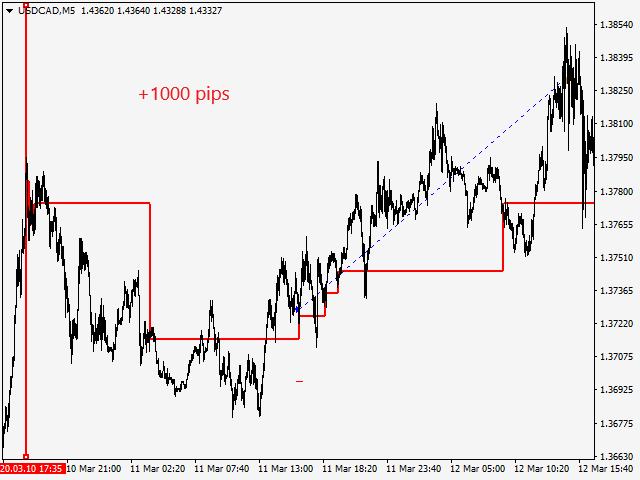
The indicator allows you to manually select areas on the chart for analyzing changes in the maximum volume over time.
This can be done using vertical lines, moving them along the graph. Or by setting certain dates in the indicator settings.
A very useful indicator to more accurately determine when the price comes out of the correction and resumes the trend movement.
The indicator displays 3 buffers so that the indicator can be connected to the Expert Advisor.
iVolX 2 DPOC-dynamic horizontal volume indicator for any time periods
- VolumeSource-selection of data for volumes (tick or real)
- DPOCOn – enabling / disabling the indicator
- DPOCFrom – start date of calculations
- DPOCTo – settlement end date
The indicator allows you to manually select areas on the chart for analyzing changes in the maximum volume over time.
This can be done using vertical lines, moving them along the graph. Or by setting certain dates in the indicator settings.
A very useful indicator to more accurately determine when the price comes out of the correction and resumes the trend movement.
The indicator displays 3 buffers so that the indicator can be connected to the Expert Advisor.
[spoiler title=”Read More…”]
- VolumeSource-selection of data for volumes (tick or real)
- DPOCOn – enabling / disabling the indicator
- DPOCFrom – start date of calculations
- DPOCTo – settlement end date
The indicator allows you to manually select areas on the chart for analyzing changes in the maximum volume over time.
This can be done using vertical lines, moving them along the graph. Or by setting certain dates in the indicator settings.
A very useful indicator to more accurately determine when the price comes out of the correction and resumes the trend movement.
The indicator displays 3 buffers so that the indicator can be connected to the Expert Advisor.
[/spoiler]