


Necessary for traders: tools and indicators
| Waves automatically calculate indicators, channel trend trading | Perfect trend-wave automatic calculation channel calculation , MT4 | Perfect trend-wave automatic calculation channel calculation , MT5 |
| Local Trading copying | Easy And Fast Copy , MT4 | Easy And Fast Copy , MT5 |
| Local Trading copying For DEMO | Easy And Fast Copy , MT4 DEMO | Easy And Fast Copy , MT5 DEMO |
[spoiler title=”Read More…”]
Necessary for traders: tools and indicators
“Co-op QQ: 556024»
“WeChat Collaboration: 556024”
“Joint e-mail: [email protected]»
I strongly recommend trend indicators, automatic calculation of the wave standard and the MT5 version of the automatic calculation of the wave standard.
I strongly recommend trend indicators, automatic calculation of the wave standard and the MT5 version of the automatic calculation of the wave standard.
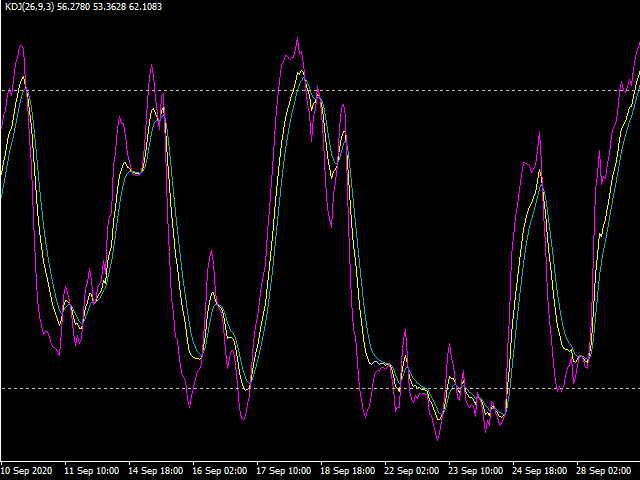
The KDJ indicator, also called the stochastic indicator, is a fairly new and practical technical analysis indicator. It was first used to analyze the futures market, and then widely used in analyzing short-term trends in the stock market. It is most commonly used in the futures and stock markets. Technical analysis tools.
The KDJ stochastic indicator is usually a statistical system used to analyze stocks. According to statistical principles, it goes through the highest price, lowest price, and closing price of the last settlement period that occurred in a particular period (usually 9 days, 9 weeks, etc.) and the proportional relationship between these three to calculate the immature random RSV value of the last calculation cycle, and then calculate the K value, D value, and J value according to the moving average smoothing method, and plot a graph to study the stock Trend.
The KDJ stochastic indicator is calculated based on the main data of the maximum price, minimum price and closing price. The resulting values of K, D, and J, respectively, are formed at a point on the indicator coordinate, connecting countless such points, just Form a full-fledged KDJ indicator that can reflect the trend of price fluctuations. Basically, it is a technical tool that uses the true volatility of price fluctuations to reflect the strength of price movements and overbought and oversold phenomena, and sends buy and sell signals before the price rises or falls. In the design process, it mainly studies the relationship between the maximum price, the lowest price, and the closing price. It also includes some of the benefits of momentum concepts, strength indicators, and moving averages, so it can be learned quickly, quickly, and intuitively. Quotes. Since the KDJ line is essentially a concept of random fluctuations, it is more accurate for determining the market trend in the short and medium term.
[/spoiler]