


The Levels indicator was created to simplify the process of building support and resistance levels and zones on selected timeframes. The indicator displays the nearest levels of the selected timeframes, which are highlighted in different colors. This significantly reduces the time required to plot them on the chart and simplifies the process of market analysis.
Horizontal support and resistance levels are used to determine price zones in which market movement may slow down or a price reversal may occur. The Levels indicator helps to determine the optimal entry and exit signals that appear during a deep market correction, or calculate stop loss and take profit.
The Levels indicator displays support and resistance levels based on price patterns that occur at local price reversal points on the chart. They are universal and can be used in any markets and timeframes. Currently, the indicator includes 28 price models that complement each other.
The colors of the price zone and horizontal lines depend on the timeframe and can be changed in the indicator settings. The indicator displays support and resistance levels on selected and lower timeframes. It keeps the charts as clear as possible and allows you to see the most important price levels without switching between timeframes.
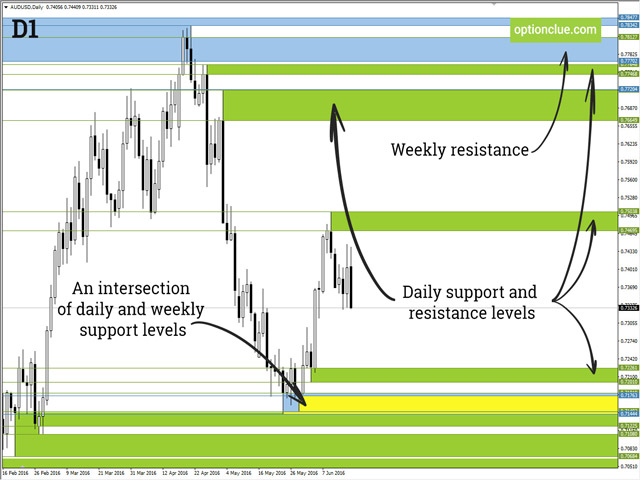
The intersection of levels on different timeframes is often an important price zone, and it is displayed on the chart as a combination of colors.
Advantages of the indicator
- Versatility – horizontal support and resistance levels are universal and can be used without reference to historical data.
- Simplicity – most of the indicator settings are related to color
- Absoluteness – unlike many technical indicators (moving averages, RSI, Stochastic, etc.), the levels are based on price movement, and not on lagging derivatives.
- Traders are forced to constantly review support and resistance levels. And the smaller the timeframe, the more often you need to update the next levels. This task is greatly simplified with the help of the indicator.
How support and resistance levels are created
Horizontal support and resistance levels have been used in trading since the beginning of the 20th century. They work because traders think they should work. The Levels indicator displays support and resistance levels based on price patterns that are formed at local price reversal points on the chart. They are versatile and can be used in any market.
Show on the chart
The colors of the price zone and horizontal lines depend on the timeframe and can be changed in the indicator settings. The indicator displays support and resistance levels on selected and lower timeframes. It keeps the charts as clear as possible and allows you to see key levels without switching between timeframes.
The most suitable parameters for each timeframe can be selected in the indicator settings
- Chart levels on this timeframe. The indicator displays horizontal levels on different timeframes. To see, for example, hourly (H1) levels, set the parameter to true.
- The number of pairs of levels (1 pair of levels means support and resistance). By default, this parameter is 1, so there is only one support and one resistance on each selected timeframe. In most cases, this number of levels is sufficient to determine the main price goals.
- The color of the support or resistance zone
- The color of the support or resistance level
The lower part of the window contains general settings that apply to each timeframe:
- The default rendering depth is 200 bars. This means that the support and resistance levels are plotted using the last 200 bars. The higher the depth of the construction, the more distant levels are displayed and the higher the load on the system. If you are interested in 1-2 nearest levels, you can reduce this parameter to 30-40.
- Price zone overlap chart (yes = true, no = false). This parameter allows you to choose whether overlapping price zones of the same period will be built or not. This makes the price chart less busy. This option is disabled by default.
[spoiler title=”Read More…”]
The Levels indicator was created to simplify the process of building support and resistance levels and zones on selected timeframes. The indicator displays the nearest levels of the selected timeframes, which are highlighted in different colors. This significantly reduces the time required to plot them on the chart and simplifies the process of market analysis.
Horizontal support and resistance levels are used to determine price zones in which market movement may slow down or a price reversal may occur. The Levels indicator helps to determine the optimal entry and exit signals that appear during a deep market correction, or calculate stop loss and take profit.
The Levels indicator displays support and resistance levels based on price patterns that occur at local price reversal points on the chart. They are universal and can be used in any markets and timeframes. Currently, the indicator includes 28 price models that complement each other.
The colors of the price zone and horizontal lines depend on the timeframe and can be changed in the indicator settings. The indicator displays support and resistance levels on selected and lower timeframes. It keeps the charts as clear as possible and allows you to see the most important price levels without switching between timeframes.
The intersection of levels on different timeframes is often an important price zone, and it is displayed on the chart as a combination of colors.
Advantages of the indicator
- Versatility – horizontal support and resistance levels are universal and can be used without reference to historical data.
- Simplicity – most of the indicator settings are related to color
- Absoluteness – unlike many technical indicators (moving averages, RSI, Stochastic, etc.), the levels are based on price movement, and not on lagging derivatives.
- Traders are forced to constantly review support and resistance levels. And the smaller the timeframe, the more often you need to update the next levels. This task is greatly simplified with the help of the indicator.
How support and resistance levels are created
Horizontal support and resistance levels have been used in trading since the beginning of the 20th century. They work because traders think they should work. The Levels indicator displays support and resistance levels based on price patterns that are formed at local price reversal points on the chart. They are versatile and can be used in any market.
Show on the chart
The colors of the price zone and horizontal lines depend on the timeframe and can be changed in the indicator settings. The indicator displays support and resistance levels on selected and lower timeframes. It keeps the charts as clear as possible and allows you to see key levels without switching between timeframes.
The most suitable parameters for each timeframe can be selected in the indicator settings
- Chart levels on this timeframe. The indicator displays horizontal levels on different timeframes. To see, for example, hourly (H1) levels, set the parameter to true.
- The number of pairs of levels (1 pair of levels means support and resistance). By default, this parameter is 1, so there is only one support and one resistance on each selected timeframe. In most cases, this number of levels is sufficient to determine the main price goals.
- The color of the support or resistance zone
- The color of the support or resistance level
The lower part of the window contains general settings that apply to each timeframe:
- The default rendering depth is 200 bars. This means that the support and resistance levels are plotted using the last 200 bars. The higher the depth of the construction, the more distant levels are displayed and the higher the load on the system. If you are interested in 1-2 nearest levels, you can reduce this parameter to 30-40.
- Price zone overlap chart (yes = true, no = false). This parameter allows you to choose whether overlapping price zones of the same period will be built or not. This makes the price chart less busy. This option is disabled by default.
The Levels indicator was created to simplify the process of building support and resistance levels and zones on selected timeframes. The indicator displays the nearest levels of the selected timeframes, which are highlighted in different colors. This significantly reduces the time required to plot them on the chart and simplifies the process of market analysis.
Horizontal support and resistance levels are used to determine price zones in which market movement may slow down or a price reversal may occur. The Levels indicator helps to determine the optimal entry and exit signals that appear during a deep market correction, or calculate stop loss and take profit.
The Levels indicator displays support and resistance levels based on price patterns that occur at local price reversal points on the chart. They are universal and can be used in any markets and timeframes. Currently, the indicator includes 28 price models that complement each other.
The colors of the price zone and horizontal lines depend on the timeframe and can be changed in the indicator settings. The indicator displays support and resistance levels on selected and lower timeframes. It keeps the charts as clear as possible and allows you to see the most important price levels without switching between timeframes.
The intersection of levels on different timeframes is often an important price zone, and it is displayed on the chart as a combination of colors.
- Versatility – horizontal support and resistance levels are universal and can be used without reference to historical data.
- Simplicity – most of the indicator settings are related to color
- Absoluteness – unlike many technical indicators (moving averages, RSI, Stochastic, etc.), the levels are based on price movement, and not on lagging derivatives.
- Traders are forced to constantly review support and resistance levels. And the smaller the timeframe, the more often you need to update the next levels. This task is greatly simplified with the help of the indicator.
Horizontal support and resistance levels have been used in trading since the beginning of the 20th century. They work because traders think they should work. The Levels indicator displays support and resistance levels based on price patterns that are formed at local price reversal points on the chart. They are versatile and can be used in any market.
The colors of the price zone and horizontal lines depend on the timeframe and can be changed in the indicator settings. The indicator displays support and resistance levels on selected and lower timeframes. It keeps the charts as clear as possible and allows you to see key levels without switching between timeframes.
- Chart levels on this timeframe. The indicator displays horizontal levels on different timeframes. To see, for example, hourly (H1) levels, set the parameter to true.
- The number of pairs of levels (1 pair of levels means support and resistance). By default, this parameter is 1, so there is only one support and one resistance on each selected timeframe. In most cases, this number of levels is sufficient to determine the main price goals.
- The color of the support or resistance zone
- The color of the support or resistance level
The lower part of the window contains general settings that apply to each timeframe:
- The default rendering depth is 200 bars. This means that the support and resistance levels are plotted using the last 200 bars. The higher the depth of the construction, the more distant levels are displayed and the higher the load on the system. If you are interested in 1-2 nearest levels, you can reduce this parameter to 30-40.
- Price zone overlap chart (yes = true, no = false). This parameter allows you to choose whether overlapping price zones of the same period will be built or not. This makes the price chart less busy. This option is disabled by default.
[/spoiler]