


Professional linear breakout charts that are displayed directly in the chart window, allowing you to trade directly from the chart in the MetaTrader 5 terminal.
Linear breakout charts can be displayed as the most widely used three-line breakout, or as a custom variation, such as a two-line or five-line breakout.
Shadows can be hidden or displayed on the chart – they provide a lot of additional information about the underlying price action.
The indicator settings include:
- Line break number – the number of lines (or lows/highs of previous candles) that must be broken to display the reversal line.
- Show wicks-show shadows (true/false)
- Use max. candles for history calculation – use the maximum number of candles to calculate the history
- UseInEA – Set to TRUE if indicator used in an EA – Set to true if indicator is used in an EA (true/false)
- Use padding top/bottom (0.0 – 1.0) – the percentage value of the visible price range (from the maximum to the minimum), which should be added to the top/bottom of the highest / lowest candle, so that the chart is more convenient for perception
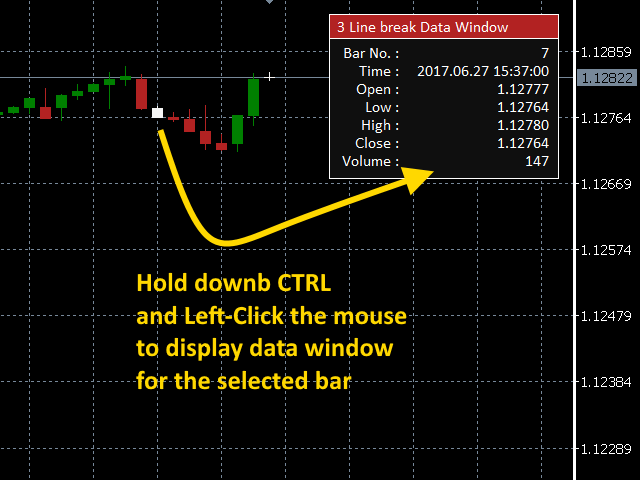
The indicator also features a custom data window where you can check the OLHC prices of each bar, as well as the opening time and total volume information.
[spoiler title=”Read More…”]
To display the data window, left-click on the selected candle while holding down the CTRL key on the keyboard.
[/spoiler]