


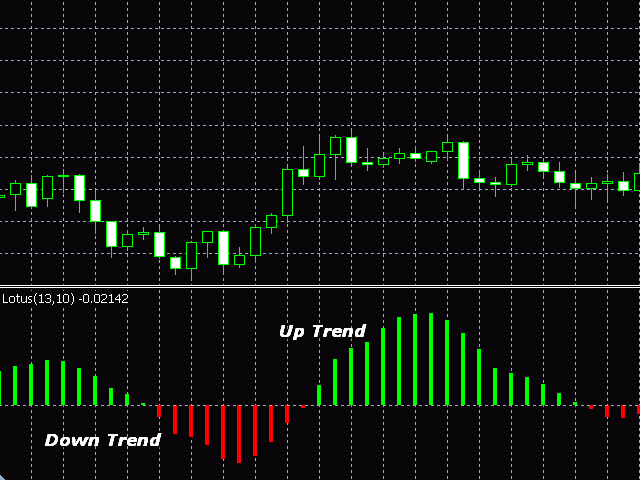

The Lotus indicator combines the features of both trend indicators and oscillators and allows you to track the smoothed rate of price change, as well as the strength of the trend and the trend change.
The uptrend is shown in the green color of the indicator line, and the downtrend is shown in red.
A long position can be opened when the indicator breaks through the zero level from the bottom up.
A short position can be opened when the indicator breaks through the zero level from top to bottom.
To exit the position, you can use the opposite signal of the indicator.
In this case, you should use a small stop loss, as the indicator may suddenly change color and direction.
The Inputs tab allows you to select:
- moving average smoothing period;
- moving average smoothing method (Simple, Exponential, Smoothed, Linear weighted);
- applicable price (Close, Open, High, Low, Median, Typical, Weighted);
- the offset of the moving average from the current bar to the bar that is set to Shift.
The Colors tab of the indicator allows you to select the color and thickness of the indicator line.
- Period – the period of the moving average;
- Method – method for smoothing the moving average;
- Applied Price – applied price;
- Shift – offset of the moving average.
[spoiler title=”Read More…”]
Note: If Shift is less than 1 or greater than Period, the warning ” Shift value error. The indicator will use the value Shift=Period”.
Note: If Shift is less than 1 or greater than Period, the warning ” Shift value error. The indicator will use the value Shift=Period”.
[/spoiler]