


There is a market maker on the stock exchange, does not let the price at some level. Up to the point. Do you want to see where?
The indicator finds and shows at what level the price hit the same place 2 or 3 times! After that, the arrow on the next candle indicates the entrance.
Candle GAP (Sharp price change on the candle chart) Now there are often price jumps on the market, which are then closed by a reverse movement.
Test my indicator, it will be a good addition to your strategy.
- It is well suited for scalping and intraday trading
- There is no redrawing (recalculation) of the indicator, the signal is sent strictly at the “closing of the bar”
- Easy adjustment of the indicator
- It works on any financial instruments
- Allows you to improve your trading strategies
Input parameters
Period (bars) – how many bars to take into account when calculating
Show arrows on bars 2 – true�alse Show the arrow. If twice, the next bar hit the same point at the price of high or low (within the specified interval period)
Made out of curiosity to see what will happen? There were a lot of entry points. We need a good signal filter. (the arrows in the form of baysell do not look painted over)
Show arrows on bars 3 – true�alse Show the arrow. If three times, the next bar hit the same point at the price of high or low (within the specified period of the history interval)
This is already what I planned, it turned out to be interesting… There is a great potential for good profit. (the arrows in the form of baysell look painted over)
Show all bars ( history) – true also save the history as arrows on the chart
Deviation_bar 3 – Distance (permissible backlash by points. Understand – Only for the third bar!!! Zero=perfect execution: point to point )
It happens that the price will almost reach the level on the third bar. Therefore, I sometimes put about 1-2 points (backlash). More signals were received.
Time interval (start-stop, h) – Time interval (filter by signals)
Draw high/low points – true�alse Show where the price matches occurred in the form of dots
I did it to check the visual logic of price matches. A useless function. But if you disable the functionsShow arrows on bars 2, Show arrows on bars 3 and look only at points without arrows in the chart.
Then at the brightest point, you will get an excellent entry option. Maybe someone, such a graphic version will be more interesting….
E-mail alert-A message to the mail
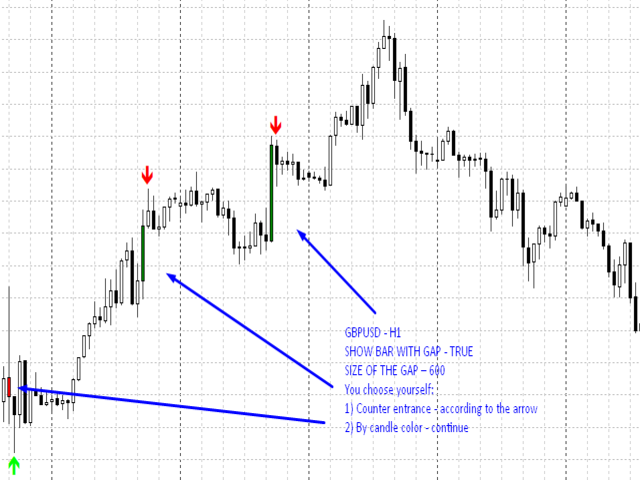
Show bar with gap – Show candle barGAP – (A sharp and large increase in price movement) – Choose the entrance yourself: against the GAP or towards the GAP (by the arrow or by the color of the candle)
Size of the gap-Specify the size of the price movement in points if N>= … – then the Sell candle will be red, the Bay candle will be green (please take into account the colors of your chart in the terminal, with my display setting)
[spoiler title=”Read More…”]
Period (bars) – how many bars to take into account when calculating
Show arrows on bars 2 – true�alse Show the arrow. If twice, the next bar hit the same point at the price of high or low (within the specified interval period)
Made out of curiosity to see what will happen? There were a lot of entry points. We need a good signal filter. (the arrows in the form of baysell do not look painted over)
Show arrows on bars 3 – true�alse Show the arrow. If three times, the next bar hit the same point at the price of high or low (within the specified period of the history interval)
This is already what I planned, it turned out to be interesting… There is a great potential for good profit. (the arrows in the form of baysell look painted over)
Show all bars ( history) – true also save the history as arrows on the chart
Deviation_bar 3 – Distance (permissible backlash by points. Understand – Only for the third bar!!! Zero=perfect execution: point to point )
It happens that the price will almost reach the level on the third bar. Therefore, I sometimes put about 1-2 points (backlash). More signals were received.
Time interval (start-stop, h) – Time interval (filter by signals)
Draw high/low points – true�alse Show where the price matches occurred in the form of dots
I did it to check the visual logic of price matches. A useless function. But if you disable the functionsShow arrows on bars 2, Show arrows on bars 3 and look only at points without arrows in the chart.
Then at the brightest point, you will get an excellent entry option. Maybe someone, such a graphic version will be more interesting….
E-mail alert-A message to the mail
Show bar with gap – Show candle barGAP – (A sharp and large increase in price movement) – Choose the entrance yourself: against the GAP or towards the GAP (by the arrow or by the color of the candle)
Size of the gap-Specify the size of the price movement in points if N>= … – then the Sell candle will be red, the Bay candle will be green (please take into account the colors of your chart in the terminal, with my display setting)
P.S. When testing by default, only one function is enabledShow arrows on bars 3
YOU need to choose a combination; time interval, period and distance (backlash). I wish you all good luck in finding the optimal trading solution!)
The indicator indicates only the level where the price was beating at the same point. The arrows are an intended entry, not a guaranteed profit.
[/spoiler]