


The Forex LTT Range System indicator shows on the chart the average ranges of market price movement for the periods M 15, H 1, H 4, D 1, W 1, MN 1.The upper and lower limits of the ranges are calculated from the opening price of the bar. Pivot is the midpoint between the bar opening price and the range boundary: if the market price is above the bar opening price, the pivot mark is located between the bar opening price and the upper range mark, if the market price is below the bar opening price, the pivot mark is located between the bar opening price and the lower range mark. The indicator removes the labels of the levels of the ranges broken by the price. The working ranges of the indicators are calculated according to the LTT System strategy.
- Language – language selection: Russian or English;
- M 15 Range – range selection in 15 minutes;
- H 1 Range – range selection for 1 hour;
- H 4 Range – range selection in 4 hours;
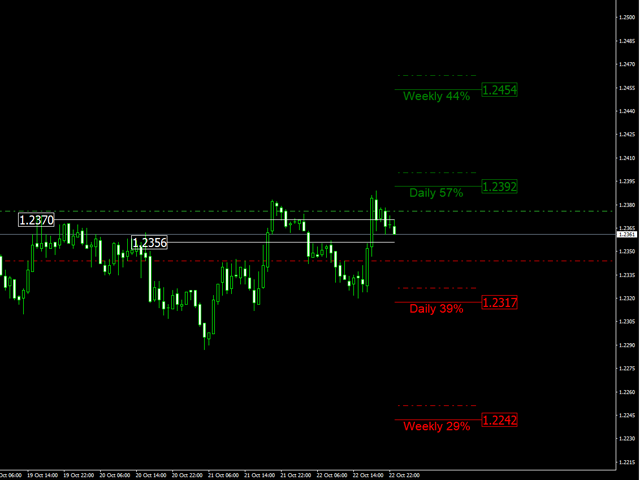
- Daily Range – selection of the daily range;
- Weekly Range – selection of the range of the week;
- Monthly Range – selection of the daily range;
- Volatility – calculation of the range by open bar, closed or real time;
- Line ASK – show or hide the ASK;
- Text Size – font size;
- Width Price Label – the size of the price label;
- Color High – the color of the upper edge of the range;
- Color Pivot – the color of the middle of the range;
- Color Low – the color of the lower edge of the range;
- From All Traffic (%) – set the percentage of the working range;
- Higher Traffic – color above the operating range;
- Lower Traffic – color below the operating range.
[spoiler title=”Read More…”]
The LTT Range System indicator is multi-currency, multi-time frame – it can be used on any instrument of the Metatrader 4 trading terminal and on any timeframe.
After opening the bar, the indicator sets the levels of the lower border, upper border and pivot (you can remove the pivot in the settings). The upper and lower bound levels can be used to set Stop Loss and Take Profit. If the price moves in one direction towards the upper limit, the lower level of the indicator will move behind it, maintaining the average range. The operation of the indicator in the opposite direction is similar. If the market price fluctuates in both directions from the opening price of the bar, the indicator pulls up both levels, limiting the average range from above and below, in this caseStop Loss and Take Profit should be moved beyond the indicator levels.
When trading, it is worth taking into account the time and distance to the edges of the range, if the price has reached the edge of the range or even broken through, it is not worth trading in the same direction, in the same range, because the range is worked out – a rollback or price fluctuations in one place are possible, and also if the price has passed most of the range, say 75-85% – it is too late to enter the deal, because only 25-15% of the movement remains. And vice versa, if there are a couple of days left in the calendar until the end of the month (end of the week), and the movement is not worked out– then most likely the price will overcome the allotted distance in the remaining couple of days. When opening positions for sale, Stop Loss and Take Profit should be set on the Ask line of the indicator, taking into account the spread. If the price has broken through the edge of the range, the indicator removes the extreme label.
Practice shows that the pivots calculated by the indicator are strong resistance and support levels, when testing the price of these levels on higher timeframes, careful observation should be carried out.
[/spoiler]