


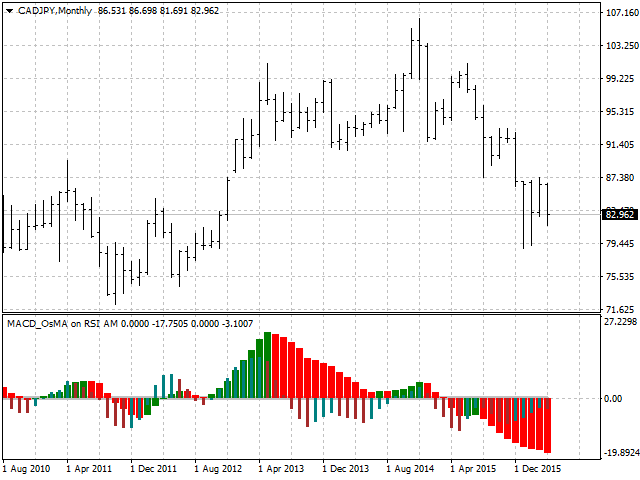

The indicator is a complex of MACD and OsMA, built on the data of another indicator-RSI. This combination allows you to get the best out of both types of indicators. On the one hand – quick response to changes in the market environment, which is characteristic of the RSI, on the other-effective market following and filtering of “noise”, which is characteristic of the MACD and OsMA.
Signals with different indicator settings can be used as:
- Intersection of 0 with the MACD or OsMA histogram;
- Changing the color of the MACD or OsMA histogram;
- Color matching of the MACD and OsMA histograms;
- Divergence of the MACD or OsMA.
- MA1_Period (>MA2_Period) – > slow moving average period;
- MA2_Period (>0) – > fast moving average period;
- Shift (>0) – > shift the fast moving average relative to the slow moving average;
- OsMA_Period (>0) > – period of the signal moving average;
- MA1_Method – method for smoothing the slow moving average;
- MA2_Method-Fast moving average smoothing method;
- OsMA_Method – method for smoothing the signal moving average;
- RSI_Period – the RSI period for which the moving averages are built;
- RSI_Price – the price of the RSI that the moving averages are based on.
[spoiler title=”Read More…”]
The indicator values on a fully formed candle are not redrawn.
Feedback and suggestions are welcome.
[/spoiler]