


Development of these ideas embedded in the favorite MACD index:
- The indicator is fully functional on the NZDUSD pair (history real-time). On other instruments, you can view signals only on the history
(then 10 bars from the current one).
The full version of the indicator can be downloaded here
Block of parameters of the MACD indicator
- Fast EMA period – the fast EMA period.
- Slow EMA period – the period of slow EMA.
- Signal Line period – the period of the signal line.
- Shift relative to the current TimeFrame (can be >0, <0, =0) – offset of the timeframe relative to the current one
TF. A value of 1 means 1 older, 2 is 2 older, a value of -1 is 1 period younger, and so on. For example, if the current period is M15, then when
At an offset of 1, the indicator will show the MACD data on M30, and at an offset of -1, the indicator will show the MACD data on M5. - The style of drawing MACD – the method of drawing the MACD indicator (histogram or line).
- MACD color change and Method of Divergence calculating – methods for determining the trend (MACD changes color) and
finding divergences (crossing the zero level (classic version) or crossing the signal line (earlier version
signal). - the Elder’s method-the method proposed by Elder in the book “The strongest signal in technical analysis” (at the
intersection of the MACD and 0, but the end of the peak/trough is the next bar after the extremum) – signals earlier, but increased
number of false ones; - at simple Zero-Level crossing – simple intersection of the MACD and 0 (classic version) – signals are late, but more
accurate; - at Signal Line crossing-the intersection of the MACD and the signal line (the best option) – accurate signals with a small
the delay.
[spoiler title=”Read More…”]
Block of parameters for displaying Divergences
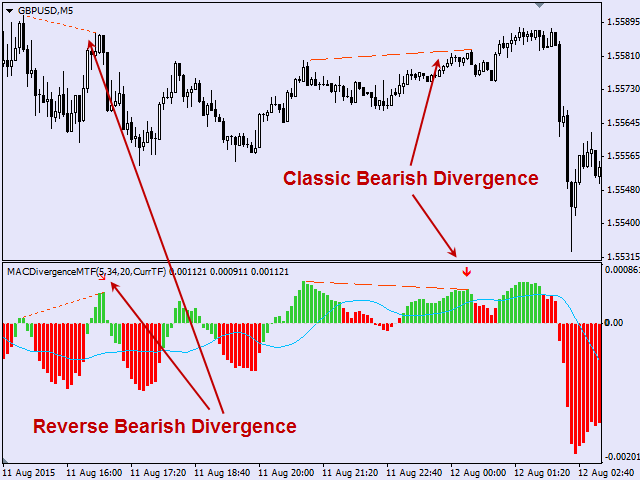
- Enable Divergence – on / off display of divergences
- Show Reverse Divergence is to show reverse divergences
- Draw Divergence Lines in indicator’s subwindow – if allowed, then, in addition to the signal arrows, the divergences will be
clearly displayed by lines in the indicator window. - Draw Divergence Lines in chart window-displays visual divergence lines in the main window.
- Classic Divergence line style – the style of Classic Divergence lines.
- Reverse Divergence line style – the style of the Reverse Divergence lines.
- Classic Bullish Divergence color – the color of the lines of the Classic Bullish Divergence.
- Classic Bearish Divergence color – the color of the lines of the Classic Bearish Divergence.
- Reverse Bullish Divergence color – the color of the Reverse Bullish Divergence lines.
- Reverse Bearish Divergence color – the color of the Reverse Bearish Divergence lines.
Block of notifications and sound settings
- ON/OFF-Sound when the signal is turned on / off
- Signal when the MACD changes color – the name of the audio file played when the trend changes (the MACD changes color).
- Signal when the Divergence is formed – the name of the audio file played when the divergence is formed.
- ON/OFF-Alert – on/off messages in the terminal when signals occur
- ON/OFF-Mail – on / off sending messages to email
- ON/OFF-Push – on / off sending push messages to mobile devices
Other Settings block
- Language-the language of messages (English and Russian are supported)
[/spoiler]