


This indicator on the toolbar with several symbols can send alerts when a strong trend is detected. This can be done by building a dashboard using the following indicators/oscillators (hereinafter referred to as indicators): RSI, Stochastics, ADX, CCI, MACD, WPR (Williams Percentage range, also called Williams%R), ROC (Price Rate of Change) and the Final Oscillator. It can be used with all timeframes from M1 to MN (only 1 timeframe can be displayed at a time). It gives you an idea of momentum, volatility, overbought/oversold, etc. Combined with your own rules and methods, this indicator will allow you to create (or improve) your own powerful system.
- You can switch the timeframe by clicking on the button.
- Continuously sorts the trend strength rating on the toolbar. However, you can disable sorting to make it easier to find a specific character. After that, the symbols will be displayed in the same order in which they were entered in the input parameter “Symbols”, or in the order in which they are displayed in the “Market Overview” window.
- Clicking inside the rectangle will open a new graph with the specified symbol and time interval.
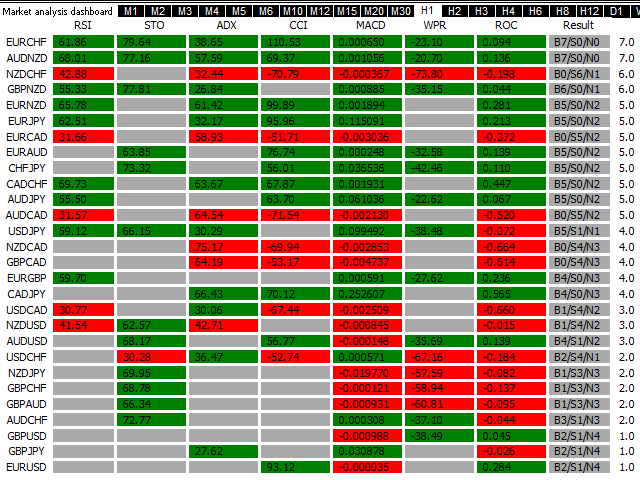
It is enough to place the indicator on one chart, and you will receive a notification on the screen from any symbol of your choice. The last column of results, visible in the first screenshot below, shows values such as, for example, “B3 /S2/N1”. This means 3 buy signals (B), 2 sell signals (S) and 1 neutral signal (N). Neutral signals are generated when the values of some indicators are within the average area (for example, 50 for RSI) or in the oversold/overbought area. More information in the blog.
[spoiler title=”Read More…”]
You can find a description and explanation of the input parameters here.
You can find a description and explanation of the input parameters here.
The indicator should be placed on the M5 chart, a clean chart without any other indicators or experts. Also note that this indicator is not supported in the strategy tester.
The indicator should be placed on the M5 chart, a clean chart without any other indicators or experts. Also note that this indicator is not supported in the strategy tester.
[/spoiler]