


What Is Market Imbalance?
Market Imbalance, also known as “IPA” or Improper Price Action, is when price moves so fast it only trades in one direction with no orders on the other side of the market to mitigate the price movement. We all know Big Banks, or “Smart Money”, can move the market by placing huge orders which in turn moves price significantly. They can do this because Big Banks are the top 10 Forex traders in the world. But unfortunately, the Big Banks cannot leave these orders in drawdown and must mitigate these orders to continue to move the market in their direction. Hence this is why Smart Money seeks out the retail trader’s stop losses (figuratively known as stop-hunting) to capture liquidity in order to move the market back to where they need it to go in order to mitigate those large orders
You can use this information in your trading by knowing that these imbalances must eventually be filled and mitigated. These “Imbalances” may take a few minutes or a few weeks or months, depending on the timeframe you trade. Trades can be entered when Market Imbalances are formed and/or when they are filled. These Market Imbalances are seen on every timeframe, from 1 minute charts up to Monthly charts, and on every instrument. Now you can use this information along with you own trading strategy and style to bank serious profits in the market.
[spoiler title=”Read More…”]
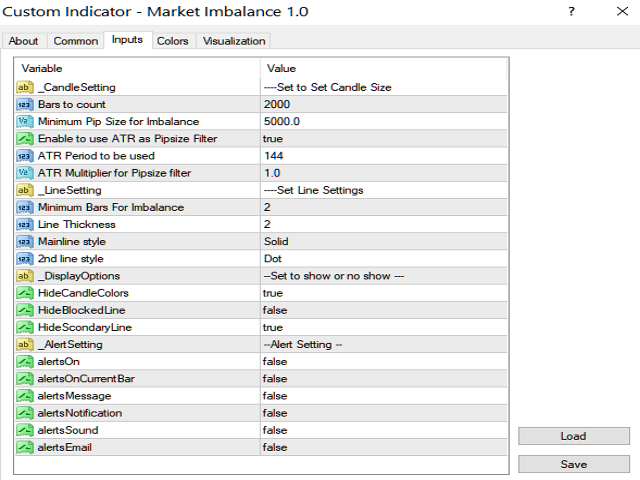
Inputs (Default values)
- Bars to count- Number of bars back to draw lines. For viewing the lines on a larger timeframe, like Weekly or Monthly, the bar count to around 250-500 bars. (2000)
- Minimum Pip Size For Imbalance- When ATR Input is False, This will be the Minimum pip size for displaying imbalances. (5000)
- Enable to use ATR as Pipsize Filter- When True, the ATR value inputted will be used. When False, use “Minimum Pip Size for Imbalance” above to determine the value. (True)
- ATR Period to be used- This is the Average True Range value. (144)
- ATR Multiplier for Pipsize filter- Multiplies the current ATR value. The higher the value, the less imbalance lines you will see. (1.0)
- Minimum Bars For Imbalance- This is the minimum number of bars needed to show an imbalance. If set to 5 for example, any imbalances filled in less than 5 bars will not be shown on the chart (2)
- Line Thickness- Thickness of Imbalance line (2)
- Mainline Style- Style of Mainline drawn (Solid)
- 2nd Line Style- 2nd Line Style. See “HideSecondaryLine” input for description (Dot)
- HideCandleColors- When False, candles that form an imbalance will be filled, colored to match the imbalance line (True)
- HideBlockedLine- When True, all imbalances that were filled will not be shown on the char. (False)
- HideSecondaryLine- When False, a secondary line is drawn to show how much of the imbalance has been mitigated. The distance between this line and the main line is unfilled market imbalance (True)
- alertsOn- Turns alerts on or off (False)
- alertsOnCurrentBar- Alerts when an Imbalance line has been drawn on the chart at the close of the candle (False)
- alertsMessage- Provides a pop up alert (False)
- alertsNotification- Provides a Push Notification to MT4 mobile. Push notifications must be set up on MT4 (False)
- alertsSound- Provides a sound when an alert is triggered (False)
- alertsEmail- Provides an email notification. Email must be set up on MT4 (False)
9/18/2021 ***UPDATED to Version 1.01***
Now you have the ability to plot up to “4” higher timeframe Market Imbalances onto a lower timeframe chart. For example, if you’re on a 5 minute chart, you can show timeframes from 15 minutes and up (avoid plotting lower timeframe imbalances on a higher timeframe chart, that defeats the purpose of the indicator).
You can plot any timeframe up to the monthly timeframe, you can change the line style, the label’s font and font size, and how far the label is shifted horizontally.
This new and improved feature allows you to see if there are other possible imbalances to be filled that you would normally not have seen unless you have a separate chart open to view them. Price may possibly continue to move past a filled lower timeframe imbalance in order to fill a higher one above or below it. Banks can use this to their advantage by using these higher timeframe Market imbalances to stop hunt traders and to mitigate orders during news events before a larger move takes place.
[/spoiler]