


this index displays on the chart the amount of peak action formed by candlesticks with peak volume content, monitoring the correlation of these candlesticks on timeframes, in the highest to the lowest. per volume level, as a result, represents a certain key protorgovku, the most important cluster-over the month, inside the week, within the day, within the hour, ..
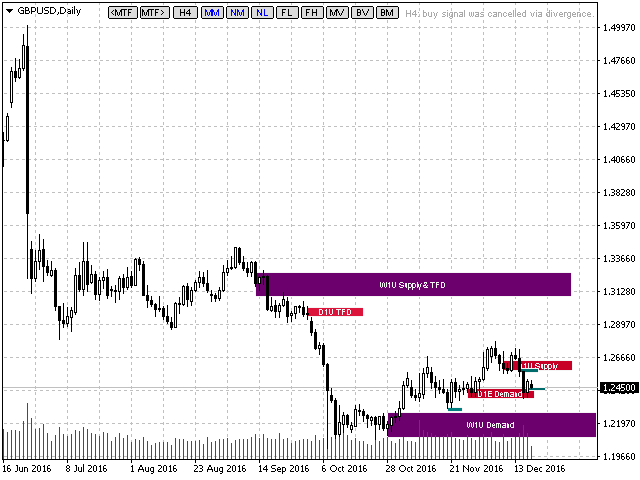
A volume level gets the requisite status if the volume level nearest to it, which is located to the left and , was divided through by the price movement in the bottom up. A volume level gets the Supply status if the volume level closest to it, located to the left and below, was broken through by a price movement from top to bottom.
In addition to the supply and demand levels, the indicator highlights the target levels-TFD (Target For Demand) and TFS (Target For Supply). The target level for the demand level is the nearest level that is not broken from the bottom up, located to the left and above the demand level. The target level for the offer level is the nearest level that is not broken from top to bottom, located to the left and below the offer level.
- MTF-markertimeframe, select the period from which volume levels will be displayed.
- MM-markersmode, enables / disables the display of levels.
- NM-nearestmarkers, in this mode, only the next few levels that are above and below the opening price of the current candle are displayed. The number of displayed levels is set in the input variable markerslastnearest.
- NL-normalizationlength, in this mode, the length of the levels is proportional to the volume of candlesticks of the timeframe to which they belong, as a result, the levels of older timeframes increase in length, facilitating visual perception. In normal mode, the length of the levels is proportional to the candle volumes of the current timeframe.
- FL-fixlength, in this mode, the levels acquire a fixed length in monitor pixels, set in the input variable markersfixlength.
- FH-fixheight, in this mode, the levels acquire a fixed height in pixels of the monitor, set in the input variable markersfixheight.
- MV-markersview, type of levels: wide or in the form of thin lines.
- BV-bordersvisible, enables / disables the display of period frames.
- BM-boxmode, enables / disables the bar tint mode.
[spoiler title=”Read More…”]
- Alerts-enables / disables duplication of the trading hint in the alerts window.
- Advices-enables / disables trading tips.
- volumeincreasecheck-cancels the signal if the volume increases when the price approaches the level.
- backwardbalancecheck-cancel the signal if the total balance of this movement has changed to the reverse when the price exits the level and returns to this level again.
- showpreliminarymarkers-enables / disables the display of preliminary levels.
- volumestype – type of volumes: tick, or real, if they are broadcast by the broker.
- buttonsposition – the location of the buttons.
- markersarea – the width of the levels from the timeframe, measured in ATR.
- markerslastnearest – the number of nearest levels displayed in NM mode.
- boxcontrast-visualization parameter for BM mode, by default it has the value 1.0, the step is fractional. If there are too many magenta and red bars on the chart, then decrease the value of this variable below 1.0. If there are too many gray and yellow bars on the chart, but almost no red and magenta bars, then increase the value of this variable above 1.0.This setting is performed once.
- futuresymbol – if you are trading a currency pair or futures, then leave this field empty, without a single character. If you are trading an index and your broker also provides a quote for futures from this index, then enter the name of the instrument that denotes this futures in this field, for example “#S