


A technical indicator that displays information about the trading volume carried out on the instrument in the form of a histogram of the distribution by price levels. It is used as an independent indicator to assess the current objective situation of the instrument, as well as in the integration format for confirmation or filtering when making trading decisions.
- Interactive profile update, real-time operation
- Five histogram calculation modes
- Ability to separate the volume of buyers and sellers
- Availability of a strict volume calculation method for higher accuracy
- Six color palette options
- The ability to manually scale the histogram (for General mode, see ” Parameters and Properties”)
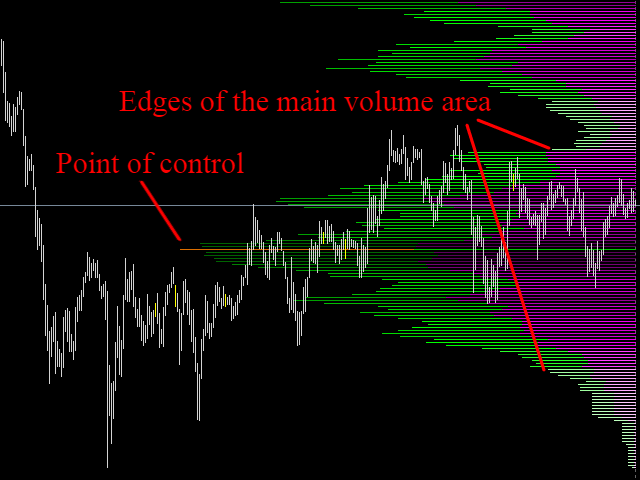
- The tonal delineation of the main volume trade, the control point is highlighted in a separate color
- Calling the properties of the indicator by right-clicking on the extreme values (High,Low) any bar on the chart
- Display mode – the mode for creating a profile histogram
- General-display for the specified number of bars, starting from the current one
- Between V-lines-displays the profile of the section that falls in the plane between two vertical lines. The lines can be moved freely with the mouse
- Fractional (Bars) – interval drawing of individual histograms for the specified number of bars (the size of one interval is specified). The number of intervals can not be more than twenty
- Fractional (Period) – interval drawing of the profile for each bar of the higher timeframe
- Rectangle – drawing a histogram based on data that falls within the rectangle area
- Placement Side – the placement side of the histogram base
- Left – the base of the profile on the left
- Right – the base of the profile on the right
- Separate Buy/Sell-separation of sales and purchases
- Color-select the color scheme of the profile from six compiled palettes
- Method of calculation – method for calculating the histogram
- Median – weighted average calculation for current bars
- Strict-strict calculation of the volume on the bars of the lower timeframe (massive calculation of the indicator histogram can lead to a decrease in the performance of the terminal, you should use it carefully)
- Autoscaling – automatic scaling of the histogram. It can be disabled only for the “General” mode – if it is necessary to display the correct histogram as proportionally as possible
- Scale (if Autoscaling is On) – the size of the profile when autoscaling, can take the values: “Small”, “Medium”, “Large” and “Full”. In “Rectangle” mode, only the “Full” value is available”
- Manual Scale (if Autoscaling is Off) – the value of the manual scale multiplier, can take integer and fractional values
- Number Of Bars To Calculate – the number of bars selected for calculation in the “General” mode or the size of the interval for the “Fractional (Bars) mode)”
- Period For Fractional Profile – the timeframe to display in the “Fractional (Period)”mode. Can’t be less than the current one
- Clock Panel – time panel, GMT time
[spoiler title=”Read More…”]
- Display mode – the mode for creating a profile histogram
- General-display for the specified number of bars, starting from the current one
- Between V-lines-displays the profile of the section that falls in the plane between two vertical lines. The lines can be moved freely with the mouse
- Fractional (Bars) – interval drawing of individual histograms for the specified number of bars (the size of one interval is specified). The number of intervals can not be more than twenty
- Fractional (Period) – interval drawing of the profile for each bar of the higher timeframe
- Rectangle – drawing a histogram based on data that falls within the rectangle area
- Placement Side – the placement side of the histogram base
- Left – the base of the profile on the left
- Right – the base of the profile on the right
- Separate Buy/Sell-separation of sales and purchases
- Color-select the color scheme of the profile from six compiled palettes
- Method of calculation – method for calculating the histogram
- Median – weighted average calculation for current bars
- Strict-strict calculation of the volume on the bars of the lower timeframe (massive calculation of the indicator histogram can lead to a decrease in the performance of the terminal, you should use it carefully)
- Autoscaling – automatic scaling of the histogram. It can be disabled only for the “General” mode – if it is necessary to display the correct histogram as proportionally as possible
- Scale (if Autoscaling is On) – the size of the profile when autoscaling, can take the values: “Small”, “Medium”, “Large” and “Full”. In “Rectangle” mode, only the “Full” value is available”
- Manual Scale (if Autoscaling is Off) – the value of the manual scale multiplier, can take integer and fractional values
- Number Of Bars To Calculate – the number of bars selected for calculation in the “General” mode or the size of the interval for the “Fractional (Bars) mode)”
- Period For Fractional Profile – the timeframe to display in the “Fractional (Period)”mode. Can’t be less than the current one
- Clock Panel – time panel, GMT time
- General-display for the specified number of bars, starting from the current one
- Between V-lines-displays the profile of the section that falls in the plane between two vertical lines. The lines can be moved freely with the mouse
- Fractional (Bars) – interval drawing of individual histograms for the specified number of bars (the size of one interval is specified). The number of intervals can not be more than twenty
- Fractional (Period) – interval drawing of the profile for each bar of the higher timeframe
- Rectangle – drawing a histogram based on data that falls within the rectangle area
- Left – the base of the profile on the left
- Right – the base of the profile on the right
- Median – weighted average calculation for current bars
- Strict-strict calculation of the volume on the bars of the lower timeframe (massive calculation of the indicator histogram can lead to a decrease in the performance of the terminal, you should use it carefully)
[/spoiler]