


Telegram group now setup for pre-sales questions and general order block chat.
Telegram group now setup for pre-sales questions and general order block chat.
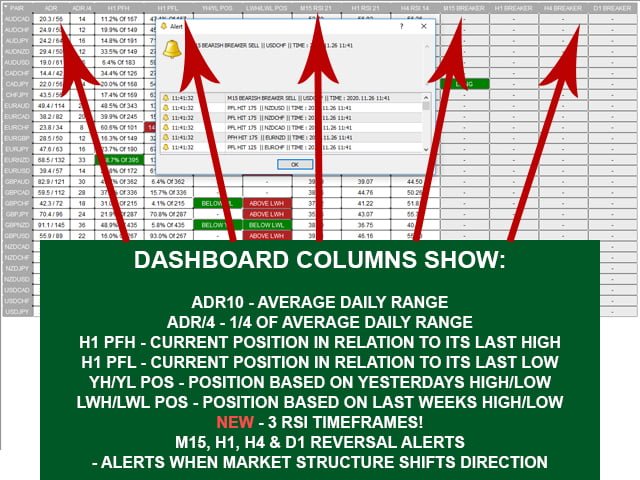
This dashboard shows a wealth of information but it’s primary purpose is to alert you to market structure reversal on specific time frames. It was developed after many people requested a dash to monitor multiple pairs and time frames at once rather than having the market reversal alerts indicator running on multiple charts in one MT5. It alerts on M15, H1, H4 and D1 timeframes when a reversal alert happens. Higher timeframes work best of course as with anything in trading.
The indicator I created to draw market structure and alert to potential reversals on a specific pair runs the dashboard.
The dashboard simply allows you to monitor multiple pairs and time frames and get alerted every time a reversal happens.
ADR – Shows the normal ADR10 (average daily range) of the pair and how many pips it’s range currently is. When a pair gets to 100% of it’s normal ADR it will turn red and alert (if set to).
ADR/4 – The ADR10 figure divided by 4. Personally I use this as my target 1 on trades when scalping. When price hits it’s ADR10 figure or exceeds it and gives a breaker you will often find it retraces about ¼ of it’s daily ADR or more.
[spoiler title=”Read More…”]
H1 PFH H1 PFL – Shows where the pair is in relation to BTMMs teachings (Google Beat The Market Maker if you are not familiar) of the 3 waves theory. Price moves in 3 waves and then tends to consolidate at level 3. This column shows what the ADR figure X3 is of the pair and what percentage it is away from the last low or high (peak formation low or peak formation high). I use this as additional confluence if I get a reversal alert on H1 or M15. This is calculated from hourly charts.
i.e. If price is over 100% from it’s peak formation low and we get a reversal alert on M15 telling us to go short it’s quite possible price is exhausted and in level 3 consolidation ready to reverse.
YH/YL POS – This just shows if price at the moment is above yesterdays high or below yesterdays low. Reversal alerts above or below daily highs and lows can often be stop hunts so this tells us at a glance where price is right now.
LWH/LWL POS – As above but indicates if price is above/below last weeks high or low. Perfect for people wanting to trade higher time frames like H1 and H4 that will respect weekly levels more
M15 Reversals – D1 Reversals – These columns will turn red or green when a reversal alert happens on that time frame as indicated by the indicator. The dash will clear these at the set time frames they monitor.
NOTE: The dashboard will not clear alerts (red/green boxes) automatically. This is by design so you can see them if away from the charts. To reset, simply refresh the indicator or close and restart.
[/spoiler]