


McDuck Indicator-an indicator that helps you determine the direction of the trend and find a point to open a position.
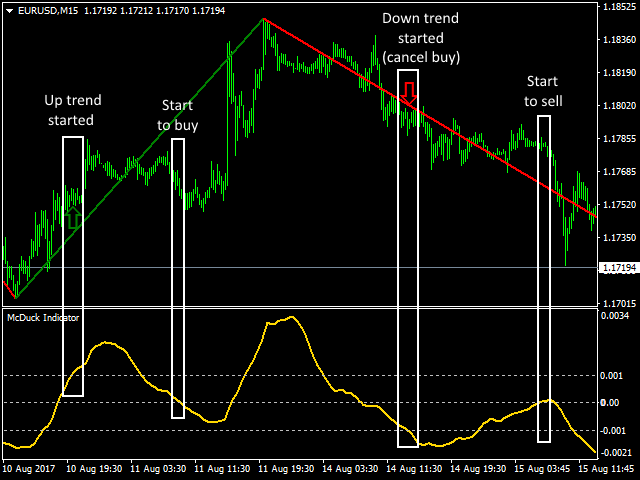
On the price chart, the indicator displays trends in the form of lines connecting their extremes (highs and lows). The green line shows that there is an uptrend at the current moment and connects the minimum of the previous downtrend with the maximum of the current uptrend. The red line tells us about the downtrend in the market and connects the high of the previous uptrend with the low of the current downtrend. The green and red arrows show the start points of the uptrends (green arrow) and downtrends (red arrow).
Under the price chart, in a separate subwindow, an oscillator is displayed, based on the standard technical indicator MACD. The oscillator has three levels: 0-zero base level; and two (mirrored in sign and equal in value) levels for determining pulses.
- FastSMAPeriod – the value of the period of the fast moving average used in the calculations of the indicator.
- SlowSMAPeriod – the value of the period of the slow moving average used in the indicator calculations.
- ImpulseLevel – the value of the pulse level of the indicator, reaching which the oscillator line determines the presence of a pulse.
[spoiler title=”Read More…”]
Conditions for purchase: 1) a green up arrow was formed on the price chart; 2) a green trend line appeared, connecting the minimum of the previous downtrend and the maximum of the current one; 3) in the subwindow, the oscillator line rose above the positive value of ImpulseLevel. This all tells us about the beginning of an uptrend and you can look for an entry point to buy. 4) As soon as the value of the oscillator falls below the base level of 0, we start buying. The signal to cancel the purchase will be the beginning of a downtrend.
Conditions for sale: 1) a red up arrow was formed on the price chart; 2) a red trend line appeared, connecting the high of the previous uptrend and the low of the current one; 3) in the subwindow, the oscillator line fell below the negative value of ImpulseLevel. This all tells us about the beginning of a downtrend and you can look for an entry point to sell. 4) As soon as the value of the oscillator rises above the base level of 0, we start selling. The signal to cancel the sale will be the beginning of an uptrend.
[/spoiler]