


The concept of supply and demand with a return to the average value
The concept of supply-demand trading relies on the mismatch of buying and selling volumes in financial markets. For ordinary traders, the supply and demand zones serve as pivot points. When considering the initial concept, it was found that the initial supply and demand trading can be performed better on the return period to the average value, rather than on the trend period. To demonstrate this concept, in order for any supply and demand zone to work as a successful trade, the price must touch the base zone, move away from it, and return to this zone again. In the end, a deal will be placed, and the price should move away from the zone again. For successful trading on supply and demand, a zigzag price movement is necessary.
Features of Mean Reversal Supply Demand
- Automatic determination of the target profit and stop loss for any zone of supply and demand.
- Analysis of daily, weekly, and monthly market profiles to further evaluate the market’s return-to-average performance (including calculating the value range and reference point).
- Analysis of daily, weekly, and monthly pivot points to improve the analysis of the return to the average value
- The ability to perform analysis on multiple timeframes on the same chart. (It is possible to use the hourly, 4-hour, and daily supply and demand zones simultaneously.)
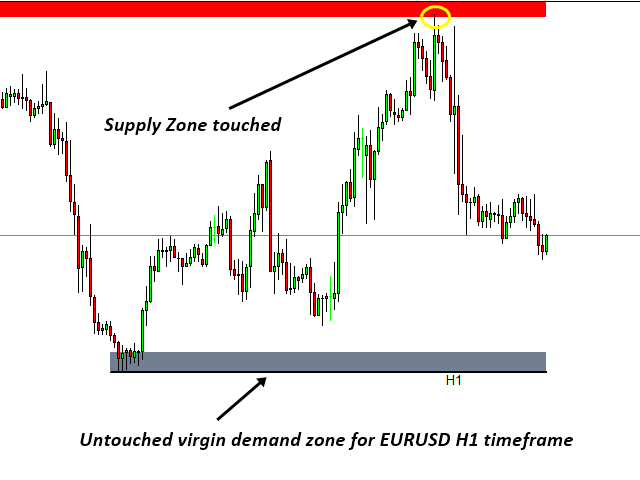
- Automatic detection of repeated touch of each supply and demand zone. (It is easy to determine which zone is left untouched and which is not.)
- It is possible to send sound notifications, send messages to e-mail and to a mobile device when the price concerns any or only the selected zone (recommended) of supply and demand.
[spoiler title=”Read More…”]
How to use Mean Reversal Supply Demand
This tool offers a daily, weekly, and monthly market profile to measure the market’s chances of returning to the average. To build a market profile, the timeframe of the chart must be carefully selected so that the market profile is calculated correctly. As a rule, it is important to recognize the price movement outside the range of values. The daily market profile can provide a short-term opportunity to return to the average value when comparing it with the weekly and monthly values.
- Daily market profile: the timeframe from M5 to H1 can be used. M30 is recommended.
- Weekly market profile: the timeframe from M30 to H4 can be used. H1 is recommended.
- Monthly market profile: a timeframe from H1 to D1 can be used. H4 is recommended.
In addition to analyzing the market profile, you can also add analysis of daily, weekly, and monthly pivot points to improve accuracy. To determine the actual supply and demand zones, it is recommended to use two or three timeframes on the same chart at the same time to determine the actual zones. For example, you can open an hourly chart and apply Mean Reversal Supply Demand to detect hourly and 4-hour supply and demand zones on the same chart. Supply and demand zones confirmed on multiple timeframes usually provide the best chances for trading. When you find a good supply and demand zone for trading, click on the frame of the demand or supply zone to see the trading settings, including the target profit, stop loss level (fully automatic).
Note
Use our notification system only for the selected zones in the best possible way. When using this tool independently, it is recommended to use market profiles and pivot point analysis together when making decisions, as well as a simple trend indicator, so as not to trade against a long-term trend. At the same time, combining the supply and demand strategy with our other powerful tools can produce better results. Combining them can always improve your chances of success in trading. We offer a wide range of trading tools for serious traders.
- Harmonic Pattern Plus
- Harmonic Pattern Scenario Planner
- Price Breakout Pattern Scanner
- Sideways Market Analyser
- Elliott Wave Trend
[/spoiler]