


This indicator is designed to build a linear regression channel. For convenience, it has several modes of operation and data rendering from the selected timeframe.
- Price – the price that will be used to calculate and build the upper and lower boundaries of the channel
- PriceHighLow – the value of the maximum and minimum price of the bar
- PriceOpenClose – the value of the opening and closing price of the bar
- Mode – indicator operation mode
- Static-the linear regression channel is always built starting from BarStart, and ends at BarEnd = 0, the channel cannot be changed by dragging the line
- Dynamic-the linear regression channel is built starting from BarStart and ending at BarEnd = 0, when a new bar appears on the chart, the channel increases in size, the beginning of the channel can be changed by dragging the line
- History-the linear regression channel is built starting from BarStart and ending at BarEnd, the beginning and end of the channel can be changed by dragging the lines
- Back-enable disables displaying the channel as background
- MainLine-showcover the main line of the channel
- Selectable – enable / disable the ability to select channel lines
- Ray-showcover the rays of the lines
- Refresh-enable / disable updating of the indicator input parameters when they are changed, the terminal is turned off, the timeframe or symbol is changed
- TimeFrame-the linear regression channel will be built using data from this timeframe, works only for Mode = Static
- BarStart – the number of the bar from which the linear regression channel will be built
- BarEnd-the number of the bar where the linear regression channel will end, works only for Mode = History, for other modes the value is always 0
- LINE_PARAMETERSBASIC_LINESPOSSIBLE LINES-text separators, for easier viewing of the indicator parameters, do not affect the indicator operation
- Value*Line* – the value of the deviation of the line from the main one, can be from -1 (lower bound) to 1 (upper bound), for example: -0.25, 0.5, etc. To hide the line, set any value that is not in the range (-1; 1), for example, 4.
- Color*Line* – the color of the line
- Style*Line* a – line style
- Width*Line* – the width of the line
[spoiler title=”Read More…”]
- PriceHighLow – the value of the maximum and minimum price of the bar
- PriceOpenClose – the value of the opening and closing price of the bar
- Static-the linear regression channel is always built starting from BarStart, and ends at BarEnd = 0, the channel cannot be changed by dragging the line
- Dynamic-the linear regression channel is built starting from BarStart and ending at BarEnd = 0, when a new bar appears on the chart, the channel increases in size, the beginning of the channel can be changed by dragging the line
- History-the linear regression channel is built starting from BarStart and ending at BarEnd, the beginning and end of the channel can be changed by dragging the lines
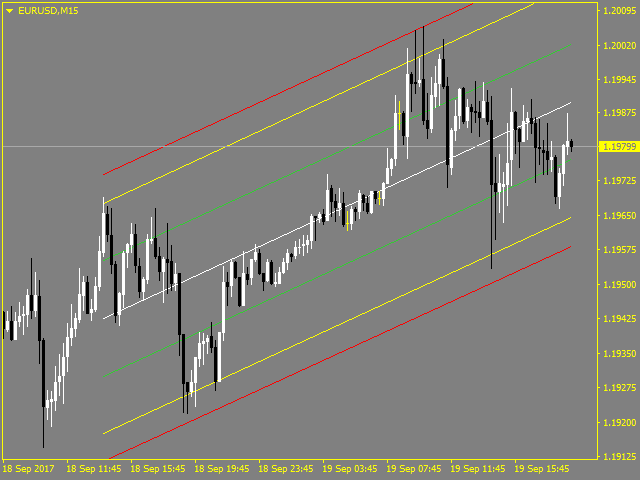
By default, the indicator plots the main line of the linear regression, the upper and lower border of the channel, as well as 4 additional lines for dividing into zones. Additionally, you can enable up to 14 lines.
Static mode is more suitable for price monitoring and analysis in a static period (for example: 50, 100, 150) separately or together with other indicators.
Mode Dynamic is more suitable for determining the levels of a possible price reversal, by delaying the beginning of the linear regression channel to the local minimummaximum.
The History mode is more suitable for analyzing the price movement on historical data, by dragging the entire linear regression channel to the area of interest.
[/spoiler]