


Fibonacci lines are a technical analysis tool for detecting support, resistance, and pivot points.
Since many traders often set stop loss and take profit in accordance with these lines, they tend to justify their own forecast. The market often turns around near the Fibonacci lines.
At the same time, the intensity of the reversal depends, among other things, on the popularity of specific Fibonacci parameters.
The Fibonacci period is adjusted by combining the previous Fibonacci lines with the previous breakouts/pivot points. The level of liquidity associated with these breakouts / pivot points acts as a reliable indicator of the strength of the Fibonacci period.
- Moving Fibonacci is a dynamic indicator of the Fibonacci lines/extensions.
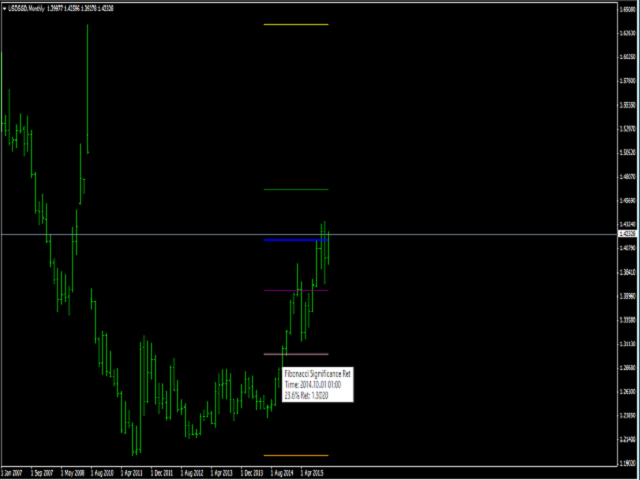
- The pullback lines are automatically displayed in an uptrend, and the extension lines are automatically displayed in a downtrend.
- The lower oscillation is formed by the minimum of the specified period, and the upper one is formed by the maximum. Between the upper and lower oscillation are the Fibonacci lines.
- Price_Data_Required–if true, the price line is displayed.
- Period – used to confirm the settings of the indicator period, the number of bars taken into account when calculating the Fibonacci values.