


The indicator was created for the “Masters of Risk” trading system.
- It shows the exit from the Balance.
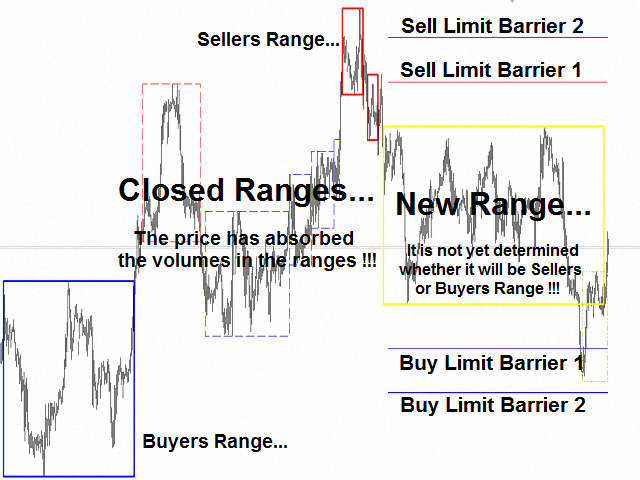
- The red rectangles show sellers’ ranges where buyers remain locked in the range.
- The blue rectangles show buyer ranges where sellers remain locked in the range.
- Dotted rectangles show closed ranges – places where the price absorbed volumes in the ranges.
- The yellow rectangle shows a new range – it has not yet been determined whether it will be a range of buyers or sellers. It shows the struggle between buyers and sellers in the balance.
- The yellow-green rectangle shows the possible expansion of the new range – it occurs at the exits of the new range, in the areas of limit barriers for sale / purchase. It shows the struggle between the major players in the market, shows the potential expansion of a new range or the possible formation of a new range.
- The red and blue lines below and above the new range show possible areasLimit Barriers. “A limit barrier is a construction that is designed to limit the price movement in any direction by constantly substituting limit orders against the movement. As a rule, there is a higher and lower accumulation.”
- In combination with the “MR Reverse Patterns” indicator you will be able to deepen your vision of the market structure. They show where the players who are locked in Range remain.
- In combination with the indicator “MR Volume POC Levels” you will be able to see how market volumes are absorbed in key locations.
[spoiler title=”Read More…”]
Note:
- The indicator synchronizes data from the timeframes on which it operates. If necessary, wait a few seconds.
- There may be slight differences between the figures drawn on the chart of the timeframe that you selected in the indicator settings and the figures drawn on the chart of smaller timeframes. This is due to the decomposition of the bar from the selected timeframe into smaller timeframes. The bar from the selected timeframe has a structure different from the smaller timeframes. This is not a mistake! This is the option we have adopted to correctly determine the inputs and outputs of the ranges.
If you liked the indicator, please rate our work, put 5 stars!
For MetaTrader 5
[/spoiler]