


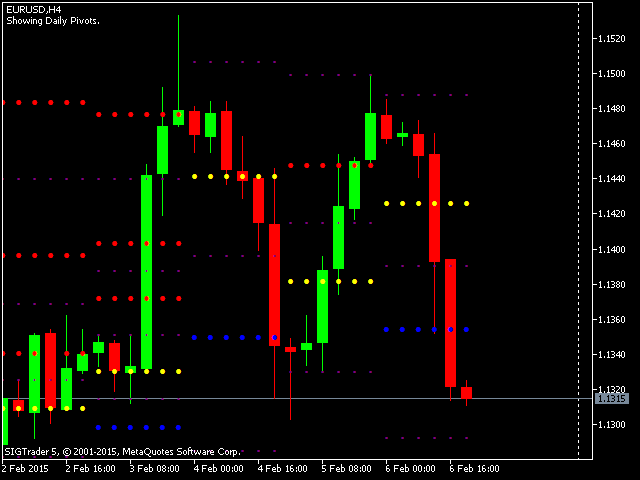

There are various ways to configure the Classic Pivot Points indicator. If you prefer manual trading and charts without unnecessary elements, you can configure the indicator so that it only draws pivots for the current session. Alternatively, if you are developing an Expert Advisor that uses pivots, the indicator can be configured to display historical pivots.
Another feature of this indicator is that you can set the start time for counting daily pivots. Instead of counting pivots with the usual time periods from 00: 00 to 23: 59, you can set your own counting start time for each day. For example, if you select 17: 00 as the start time, the indicator will calculate the reversals taking into account the bar opened at 17:00, since this will be the opening time of the daily session, and the bar at 16:59 (the next day) as the closing bar of this day.
It is possible to show/hide pivot values in the data window.
- SetTimeFrame-setting the timeframe from which the pivots will be counted.
- ShowValuesInDataWindow-depending on whether true or false is set, this parameter controls the display of historical pivot values in the data window (true-show, false-hide).
- ShowMedians – (true/false) the parameter is valid only if the ShowHistoricalIndicatorValuesOnChart parameter is set to false; if true, median lines are drawn between the pivot and the values of the support and resistance levels.
- UseCustomStartTime – (true/false) note that this property is valid when setting SetTimeFrame on a daily timeframe.
- startTime-enter the start time in the specified format, i.e. hh: mm; the parameter is valid only if the value is true in the UseCustomStartTime parameter.
- ShowHistoricalIndicatorValuesOnChart – (YES/NO) this parameter is used to select the display of historical pivot values on the chart. Set the value to NO to display the pivots for the current session.
- pcolor – select the pivot color.
- scolor-select the color of the support levels.
- rcolor-select the color of the resistance levels.
- medianscolor-selects the color of the median values.
[spoiler title=”Read More…”]
NB. Note that the set startTime value must correspond to the opening time of any bar on the current chart. For example, you will not be able to set startTime to 17: 30 if the indicator is applied to an hourly chart due to the absence of a bar opening at this time on this chart.
NB. Note that the set startTime value must correspond to the opening time of any bar on the current chart. For example, you will not be able to set startTime to 17: 30 if the indicator is applied to an hourly chart due to the absence of a bar opening at this time on this chart.
[/spoiler]