


Are you tired of the large number of open charts and from the observation of many different currency pairs? MCTSIP will track the strength of 30 currency pairs and show the best pairs to trade. You no longer need to guess which currency is stronger / weaker. No more trading a pair that barely moves.
You can have many charts open in order to determine the best pair to trade on multiple timeframes. MCTSIP is able to track the strength of currencies on timeframes that differ from the current one.
This is an indispensable tool in manual trading. It gives the trader an advantage in the form of information about how strong the currency really is.
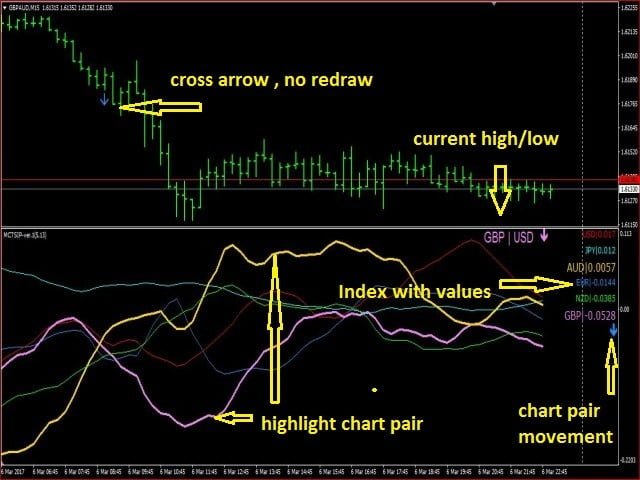
- MCTSIP tracks the strength of the following currencies: EUR, USD, GBP, JPY, AUD, and NZD.
- The movement of each currency is measured against 7 other currencies to determine its strength.
- This value is displayed in the indicator window for each currency, and the currencies from the strongest to the weakest are also shown.
The sensitivity can be adjusted by changing the MA values so that the indicator is more or less sensitive to currency movements, and so that it is set to the traded timeframe.
Note: The indicator may not display correctly in the strategy tester, as it requires processing a large amount of historical data for each pair.
[spoiler title=”Read More…”]
This indicator shows the strength of several currencies individually, measured against all other currencies. It measures the price movements of the currency pair of the current chart by comparing the base and quoted currencies, which are the base / quoted in all other pairs, and shows the strength movements. The speed of force change is displayed, the sensitivity of which can be adjusted using the Moving Average values.
- Monitors EUR USD GBP JPY AUD NZD (CAD and CHF in the near future).
- Data on the strength of individual currencies.
- Displays the current best currency pair with the maximum / minimum strong currencies.
- Arrows are used to display the movements on the chart, they are not redrawn.
- Ability to send alerts.
- fast_ma = 5: fast moving average, must be less than the value of the [slow] parameter.
- slow_ma = 13: slow moving average, must be greater than the value of the [fast] parameter.
- timeframe = current: timeframe, if 0 (current), the chart timeframe will be used.
- width = 3: the size of the selected lines of the graph pairs, if the value is 0, the selection of lines will not be used (all lines will be the same thickness).
- font_size = 12: the size of the text of the indexes of all currencies, when set to 0 (zero) , the text of the indexes for all currencies will be the same.
- type = line: select a line or histogram.
- current_only = true: if true, only 2 lines for the active chart will be shown; if false, all lines for all currencies will be shown. If current_only is set to false, the parameter will not work with the histogram. To display the histogram, select:
- current_only: true,
- type: histogram
- Alerts = true: if true, the terminal will send pop-up alerts if the strength of the current chart has changed up/down.
- highest_lowest_alert = true: if true, the terminal will send pop-up alerts if the currencies with the maximum and minimum strength have changed.
- bars = 500: the number of bars to process and display the indicator. Note: if the value is 0 (zero), ALL the bars of the chart will be processed, which may take a long time due to the size of the data being processed.
- suffix: the suffix used by the broker: for example, XXXXXXpro.
- current_only: true,
- type: histogram
[/spoiler]