


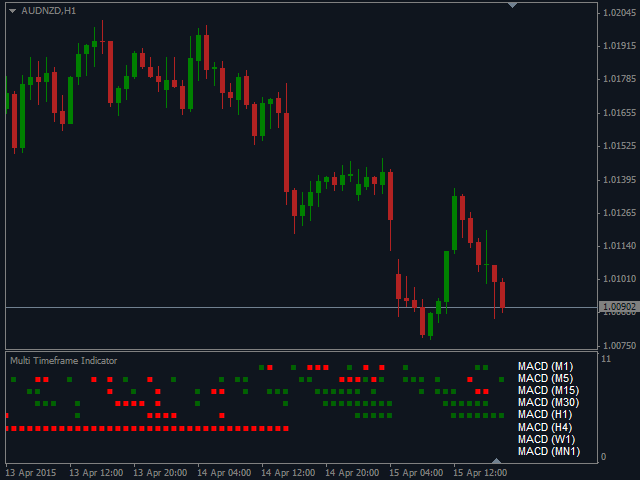

Multi Timeframe Indicator combines many functions and can be considered a universal assistant to the trader in making decisions. Its main task is
is the display of up to ten indicators simultaneously, using a total of
one small square for each indicator. Among the indicators available for
display are Awesome Oscillator, CCI, DeMarker, MACD, RSI, RVI, Stochastic,
Larry Williams ‘ Percent Range, Bulls Power, and Bears Power. An important function of the indicator is the ability to track signals from other timeframes. You can choose different combinations, including displaying different timeframes of the same indicator, as well as multiple timeframes of different indicators.
The principle of displaying squares on different timeframes is based on the presence of a signal at the time of opening the bar of the current timeframe, that is, you can select the parameters and timeframe of each indicator separately from the history to achieve the best results – the signals will not be redrawn. For convenience, the timeframe that you selected in the display settings is indicated in parentheses next to the indicator name on the chart. If you want to use all the indicators only on the timeframe of the open chart without using a multi-time frame, then this option is also available. You can change the default colors (red for sale and green for purchase) for the squares, their size, as well as the color of the indicator name and its timeframe in the settings.
You can enable alerts with different settings.
Indicator Parameters
- First Indicator…Tenth Indicator-select from the first to the tenth indicator
- First indicator timeframe…Tenth indicator timeframe-select the timeframe of each indicator
- Bears Power Period – the period of the Bears Power indicator
- Bears Power Applied Price – the price used in the calculation
The Bears Power Indicator - Bulls Power Period – the period of the Bulls Power indicator
- Bulls Power Applied Price – the price used in the calculation
The Bulls Power Indicator - CCI Period – the period of the CCI indicator
- CCI Applied Price – the price used in the calculation
CCI indicator - CCI Level – the level of the CCI indicator, at the
intersection of which a signal appears. This value is entered for the
upper level, and calculated automatically for the lower level as
negative - DeMarker Period – the period of the DeMarker indicator
- DeMarker Upper Level – the upper level of the indicator
DeMarker, at the intersection of which a sell signal appears - DeMarker Lower Level – the lower level of the DeMarker indicator,
at the intersection of which a buy signal appears - MACD Fast EMA Period – period of the fast EMA
the MACD indicator - MACD Slow EMA Period – the period of slow EMA
the MACD indicator - MACD Signal SMA Period – the period of the signal SMA
the MACD indicator - MACD Applied Price – the price used in the calculation
the MACD indicator - RSI Period – the period of the RSI indicator
- RSI Applied Price – the price used in the calculation
the RSI indicator - RSI Upper Level – the upper level of the indicator
The RSI, at the intersection of which a sell signal appears - RSI Lower Level – the lower level of the indicator
The RSI, at the intersection of which a buy signal appears - RVI Period – the period of the RVI indicator
- K Period Stochastic – K period of the Stochastic indicator
- D Period Stochastic – D period of the Stochastic indicator
- Slowing Stochastic – the period of the Stochastic indicator averaging
- Stochastic Slowing Method – method for averaging the Stochastic indicator
- Stochastic Upper Level – the upper level of the indicator
Stochastic, at the intersection of which a sell signal appears - Stochastic Lower Level – the lower level of the indicator
Stochastic, at the intersection of which a buy signal appears - WPR Period – period of the Larry Williams’ Percent Range indicator
- WPR Upper Level – the upper level of the indicator
Larry Williams’ Percent Range, at the intersection of which a signal appears
for sale - WPR Lower Level – the lower level of the indicator
Larry Williams’ Percent Range, at the intersection of which a signal appears
for purchase - Size of the brick – the size of the square,
displaying a signal - Color for sell signal bricks – color of the square for the
sell signal - Color for buy signal bricks – color of the square for the
buy signal - Color of indicator label – color of the indicator name and timeframe
- Bars to load – the number of bars to calculate
- Turn on the alerter – turn notifications on
- Bricks of the same color to alert – the number of cubes of the same color to trigger the alert
- Check
for signals on current(running) or previous (closed) bar-ability to
track the signal on the current (open) or previous (closed)
bar
[spoiler title=”Read More…”]
Multi Timeframe Indicator combines many functions and can be considered a universal assistant to the trader in making decisions. Its main task is
is the display of up to ten indicators simultaneously, using a total of
one small square for each indicator. Among the indicators available for
display are Awesome Oscillator, CCI, DeMarker, MACD, RSI, RVI, Stochastic,
Larry Williams ‘ Percent Range, Bulls Power, and Bears Power. An important function of the indicator is the ability to track signals from other timeframes. You can choose different combinations, including displaying different timeframes of the same indicator, as well as multiple timeframes of different indicators.
The principle of displaying squares on different timeframes is based on the presence of a signal at the time of opening the bar of the current timeframe, that is, you can select the parameters and timeframe of each indicator separately from the history to achieve the best results – the signals will not be redrawn. For convenience, the timeframe that you selected in the display settings is indicated in parentheses next to the indicator name on the chart. If you want to use all the indicators only on the timeframe of the open chart without using a multi-time frame, then this option is also available. You can change the default colors (red for sale and green for purchase) for the squares, their size, as well as the color of the indicator name and its timeframe in the settings.
You can enable alerts with different settings.
- First Indicator…Tenth Indicator-select from the first to the tenth indicator
- First indicator timeframe…Tenth indicator timeframe-select the timeframe of each indicator
- Bears Power Period – the period of the Bears Power indicator
- Bears Power Applied Price – the price used in the calculation
The Bears Power Indicator - Bulls Power Period – the period of the Bulls Power indicator
- Bulls Power Applied Price – the price used in the calculation
The Bulls Power Indicator - CCI Period – the period of the CCI indicator
- CCI Applied Price – the price used in the calculation
CCI indicator - CCI Level – the level of the CCI indicator, at the
intersection of which a signal appears. This value is entered for the
upper level, and calculated automatically for the lower level as
negative - DeMarker Period – the period of the DeMarker indicator
- DeMarker Upper Level – the upper level of the indicator
DeMarker, at the intersection of which a sell signal appears - DeMarker Lower Level – the lower level of the DeMarker indicator,
at the intersection of which a buy signal appears - MACD Fast EMA Period – period of the fast EMA
the MACD indicator - MACD Slow EMA Period – the period of slow EMA
the MACD indicator - MACD Signal SMA Period – the period of the signal SMA
the MACD indicator - MACD Applied Price – the price used in the calculation
the MACD indicator - RSI Period – the period of the RSI indicator
- RSI Applied Price – the price used in the calculation
the RSI indicator - RSI Upper Level – the upper level of the indicator
The RSI, at the intersection of which a sell signal appears - RSI Lower Level – the lower level of the indicator
The RSI, at the intersection of which a buy signal appears - RVI Period – the period of the RVI indicator
- K Period Stochastic – K period of the Stochastic indicator
- D Period Stochastic – D period of the Stochastic indicator
- Slowing Stochastic – the period of the Stochastic indicator averaging
- Stochastic Slowing Method – method for averaging the Stochastic indicator
- Stochastic Upper Level – the upper level of the indicator
Stochastic, at the intersection of which a sell signal appears - Stochastic Lower Level – the lower level of the indicator
Stochastic, at the intersection of which a buy signal appears - WPR Period – period of the Larry Williams’ Percent Range indicator
- WPR Upper Level – the upper level of the indicator
Larry Williams’ Percent Range, at the intersection of which a signal appears
for sale - WPR Lower Level – the lower level of the indicator
Larry Williams’ Percent Range, at the intersection of which a signal appears
for purchase - Size of the brick – the size of the square,
displaying a signal - Color for sell signal bricks – color of the square for the
sell signal - Color for buy signal bricks – color of the square for the
buy signal - Color of indicator label – color of the indicator name and timeframe
- Bars to load – the number of bars to calculate
- Turn on the alerter – turn notifications on
- Bricks of the same color to alert – the number of cubes of the same color to trigger the alert
- Check
for signals on current(running) or previous (closed) bar-ability to
track the signal on the current (open) or previous (closed)
bar
[/spoiler]