


This indicator is based on the popular Parabolic SAR indicator.
The Parabolic SAR indicator is displayed on the chart as points located above or below the price. In the case of an uptrend, the indicator points are located below the price, in the case of a downtrend, the points are displayed above the price.
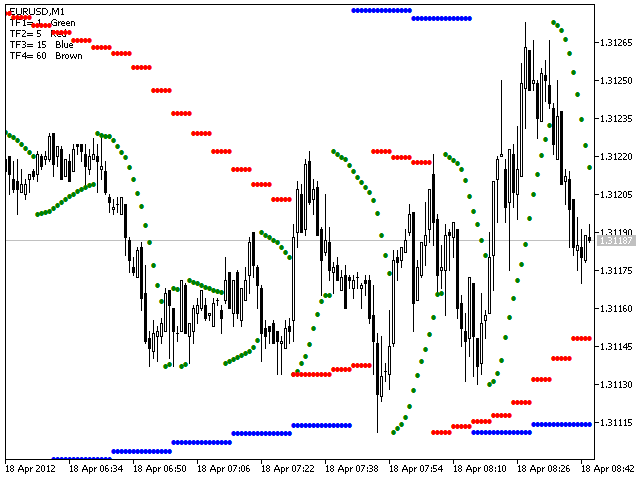
The MTF-PSAR indicator shows Parabolic SAR data from several timeframes specified in the input parameters.
Default settings:
- TF1 = 1;
- TimeFrame2b = true;
- TF2 = 5;
- TimeFrame3b = true;
- TF3 = 15;
- TimeFrame4b = true;
- TF4 = 60;
- InpPSARStep = 0.02;
- InpPSARMaximum = 0.2;
The values TF1-TF4 can be in the following ranges:
- TF1 – from M1 (1) to H4 (240);
- TF2 – from M5 (5) to D1 (1440);
- TF3 – from M15 (15) to W1 (10080);
- TF4-from M30 (30) to MN1 (43200).
All selected timeframes must be no lower than the timeframe of the current chart.
You can use data from all four or fewer timeframes using the parameters: TimeFrame1b – TimeFrame4b.